CMDB Workspace
Work faster with configuration data in Cetegra Care: search, visualize relationships, monitor CMDB health, and leverage insights.
The CMDB Workspace in Cetegra Care gives power users a modern, streamlined interface to find, analyze, and maintain Configuration Items (CIs). Use it to search across your CMDB, visualize relationships, track health and data quality, and access deep insights.
Audience: Configuration Managers, CMDB Admins, Advanced IT Operations
Access: Requires Cetegra Care access with appropriate CMDB roles and domain visibility.
Quick start
- Open Cetegra Care: In Cetegra Workspace, open the Application Widget and click Cetegra Care.
- Open CMDB Workspace: In the top menu, click Workspaces → CMDB Workspace.
Note on visibility
Some entries may appear empty and some totals may not match your expectations. This usually means the CI belongs to a different domain and is not visible to you. Counts may include records outside your domain.
What you can do
- Search & Filter: Use natural language and attribute filters to find CIs fast.
- Explore Relationships: Visual topology, drill-down, and impact context.
- Maintain CMDB Health: Monitor completeness, correctness, and compliance; act on issues.
- Leverage Insights: Dashboards for growth, data quality, discovery coverage, and adoption.
- Work Faster: Jump to related records and tools directly from the workspace.
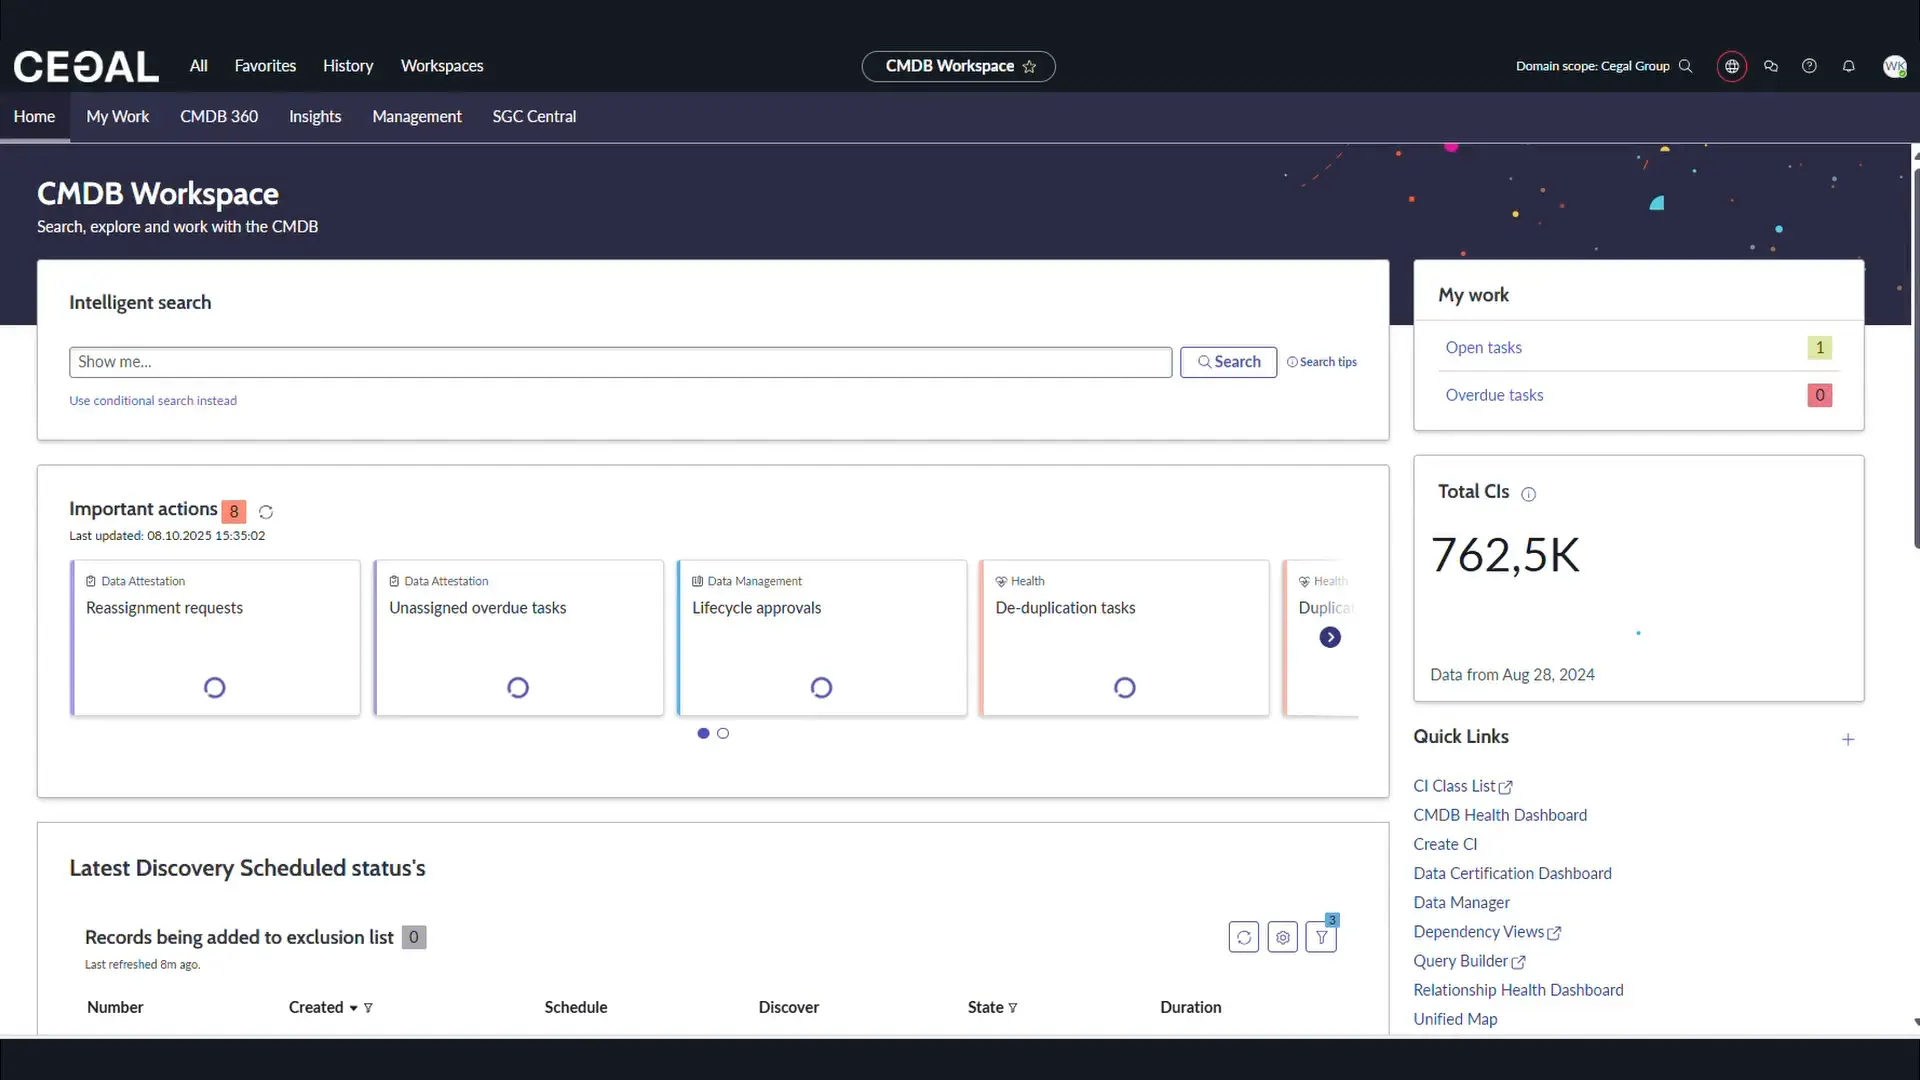
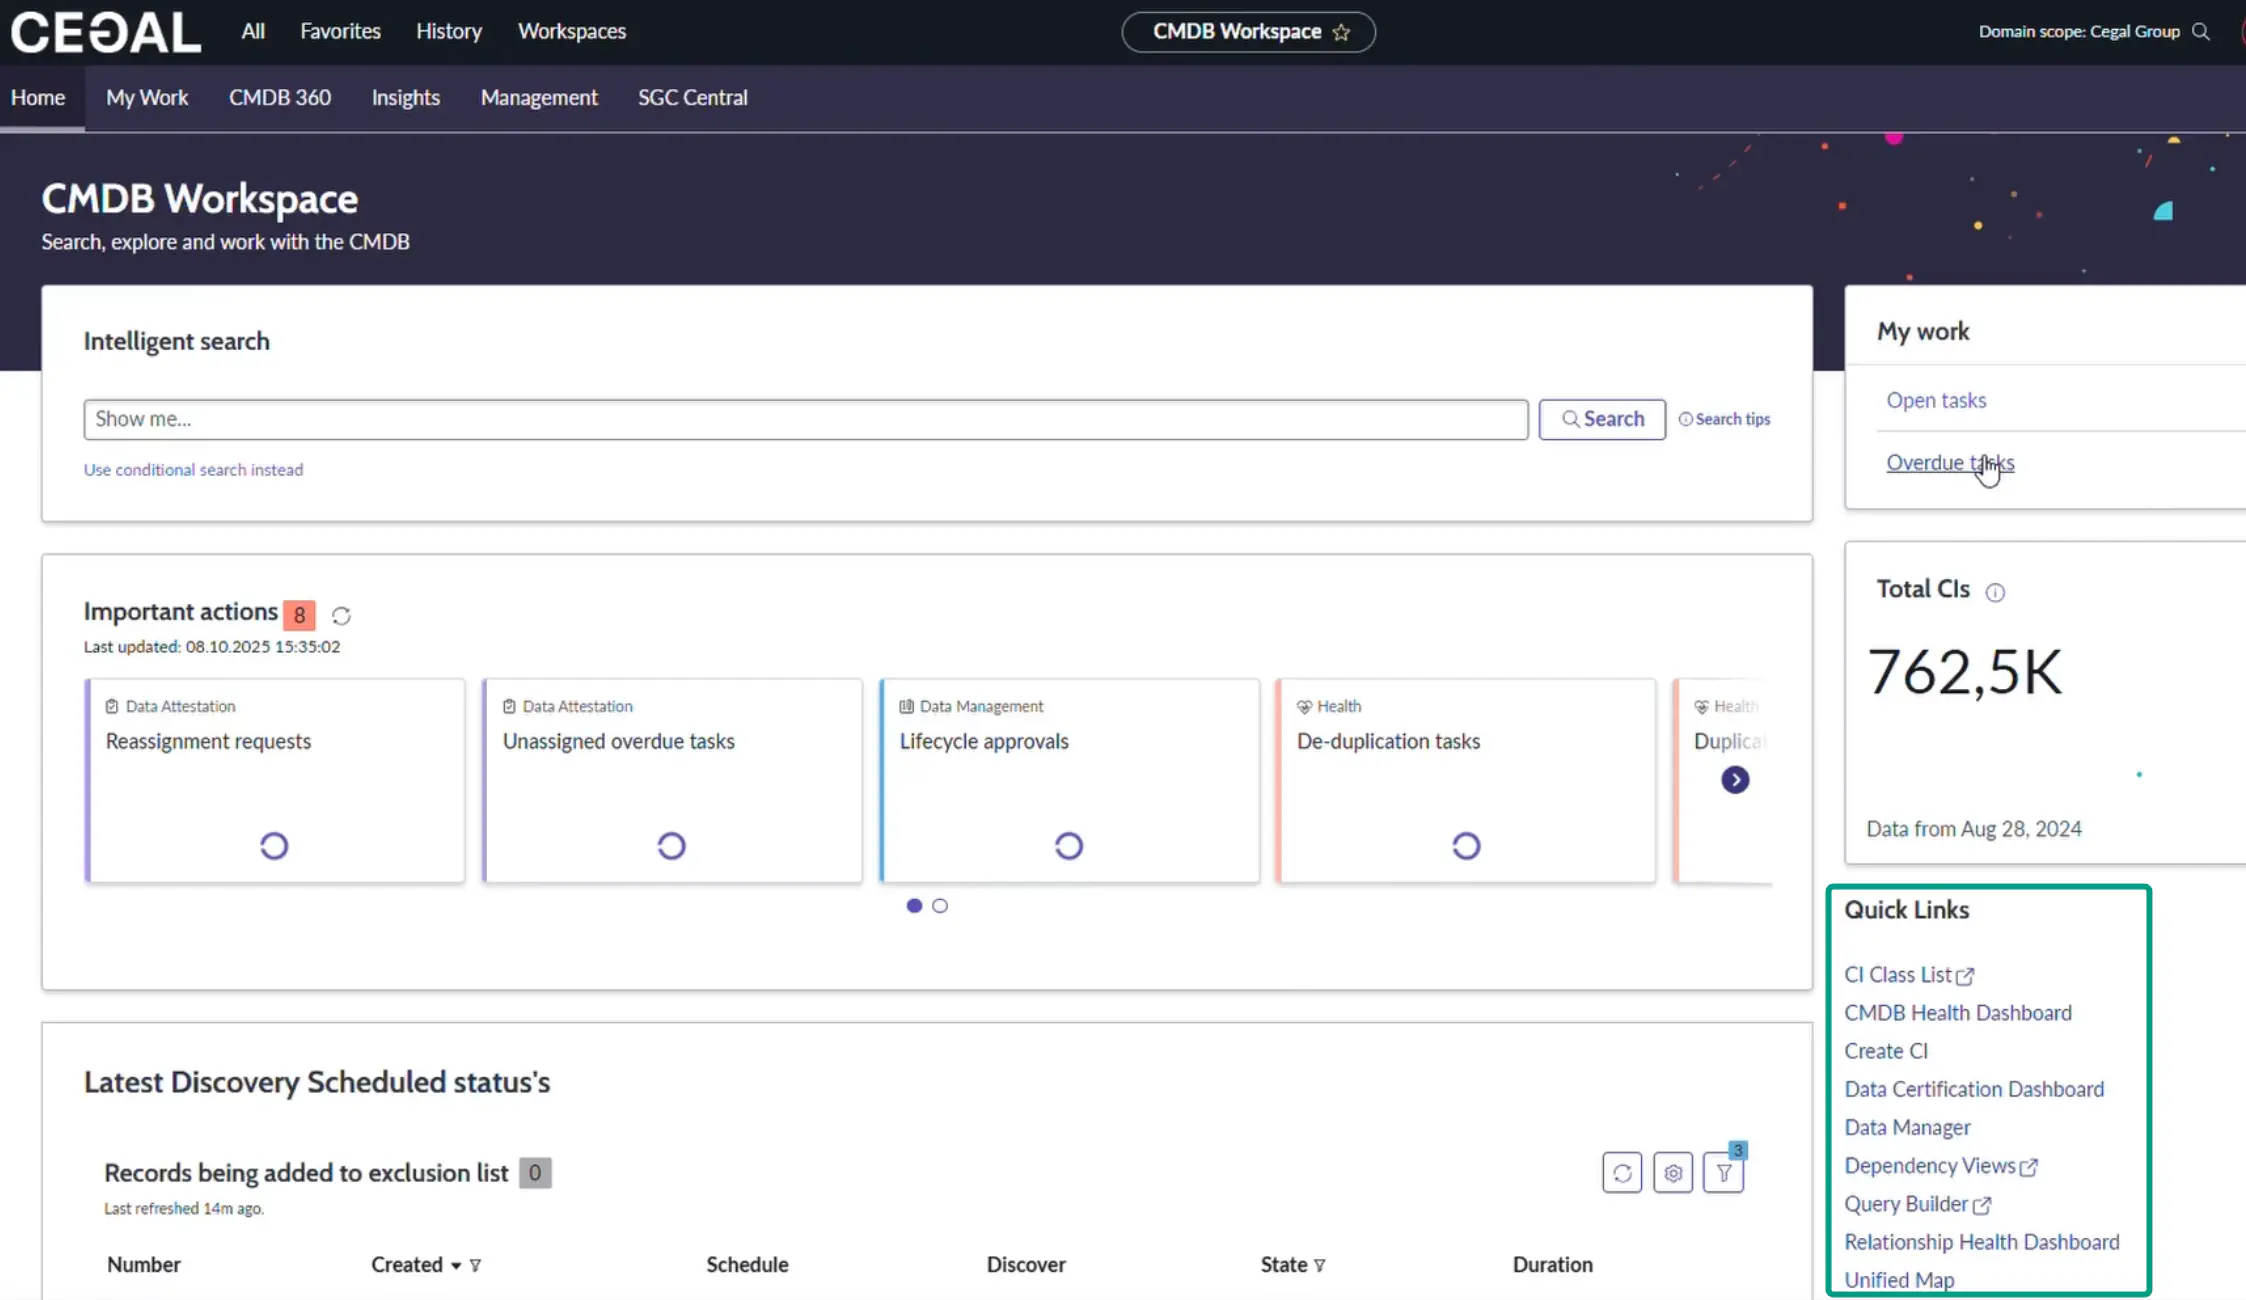
Home tab
The Home tab gives an operational overview and fast paths to common actions.
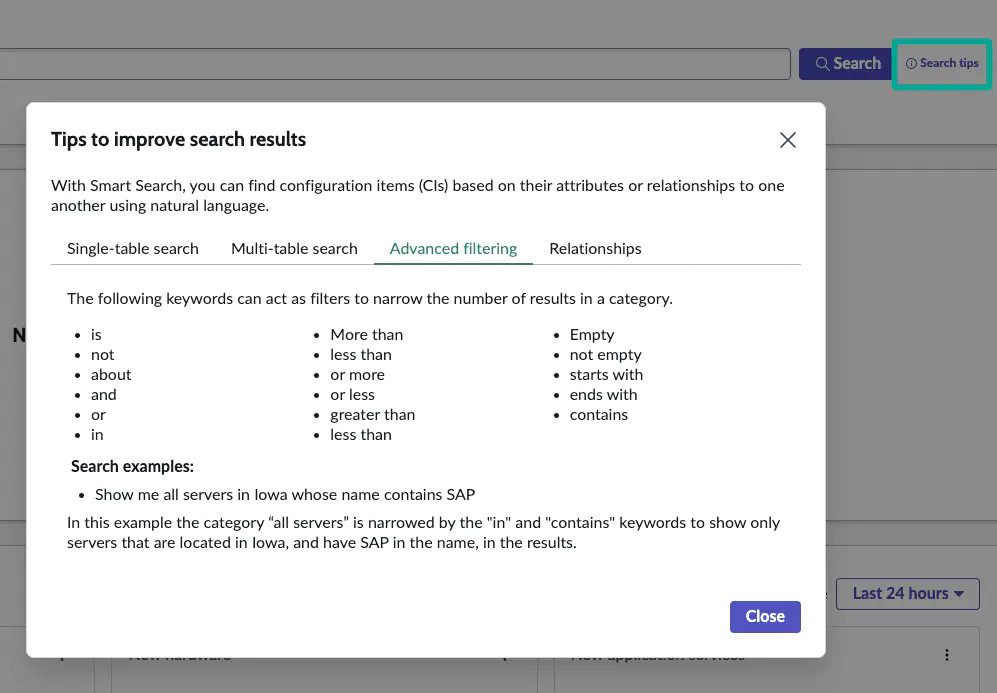
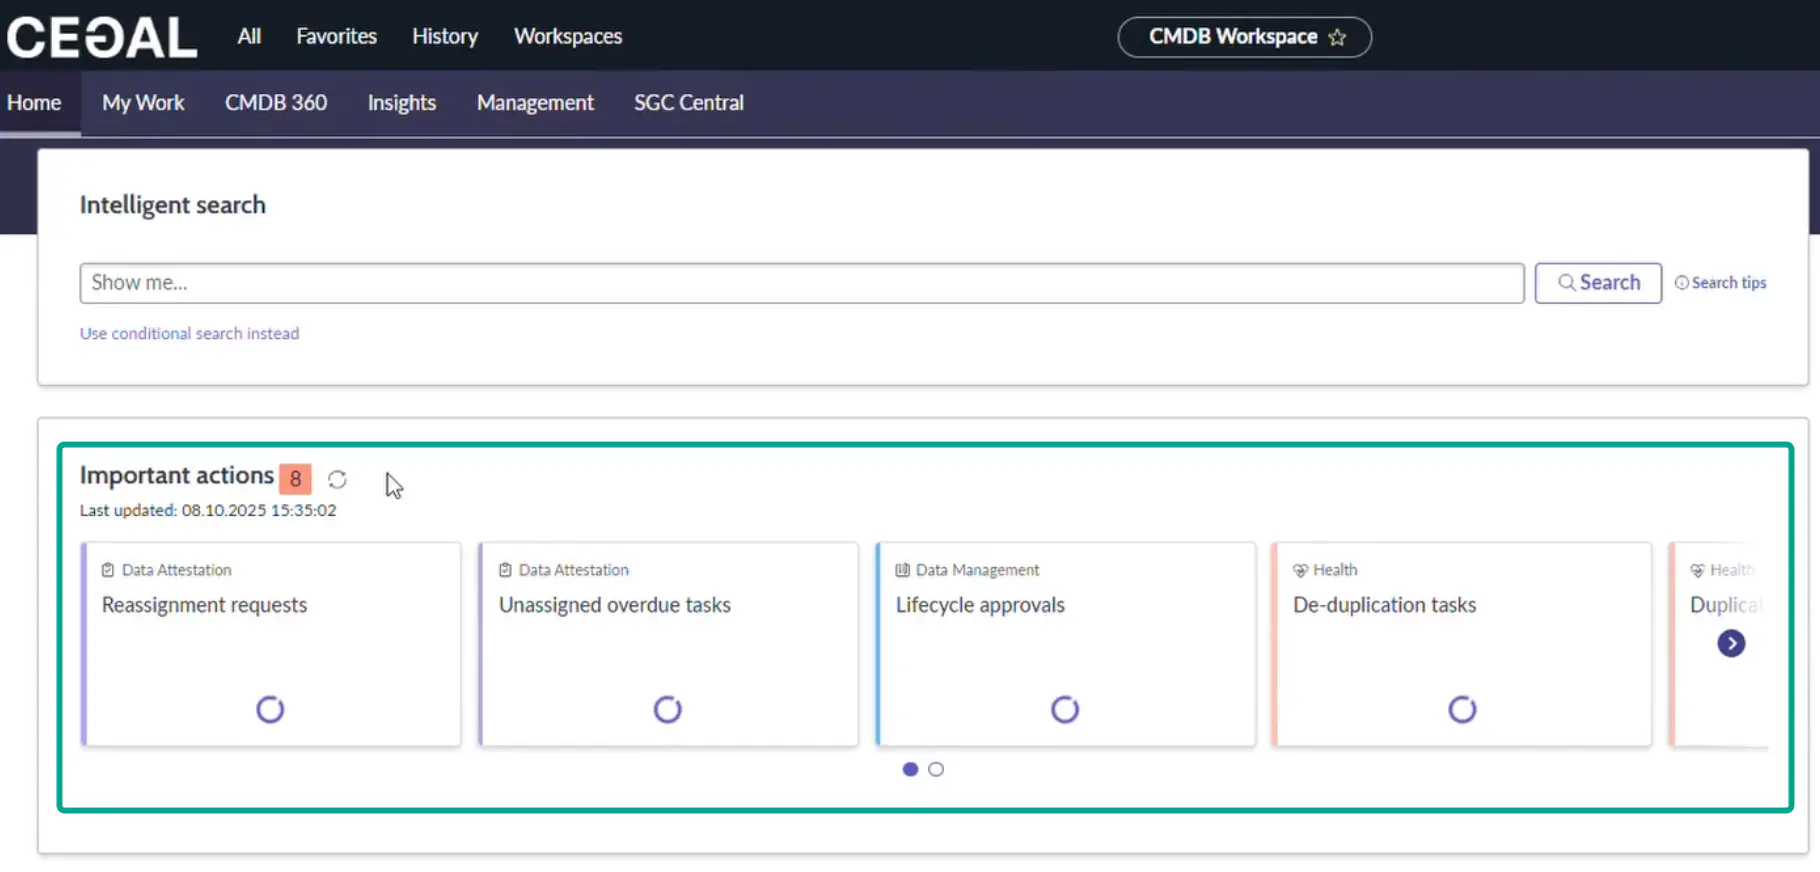
Intelligent Search
Use natural language or attribute terms to find CIs.
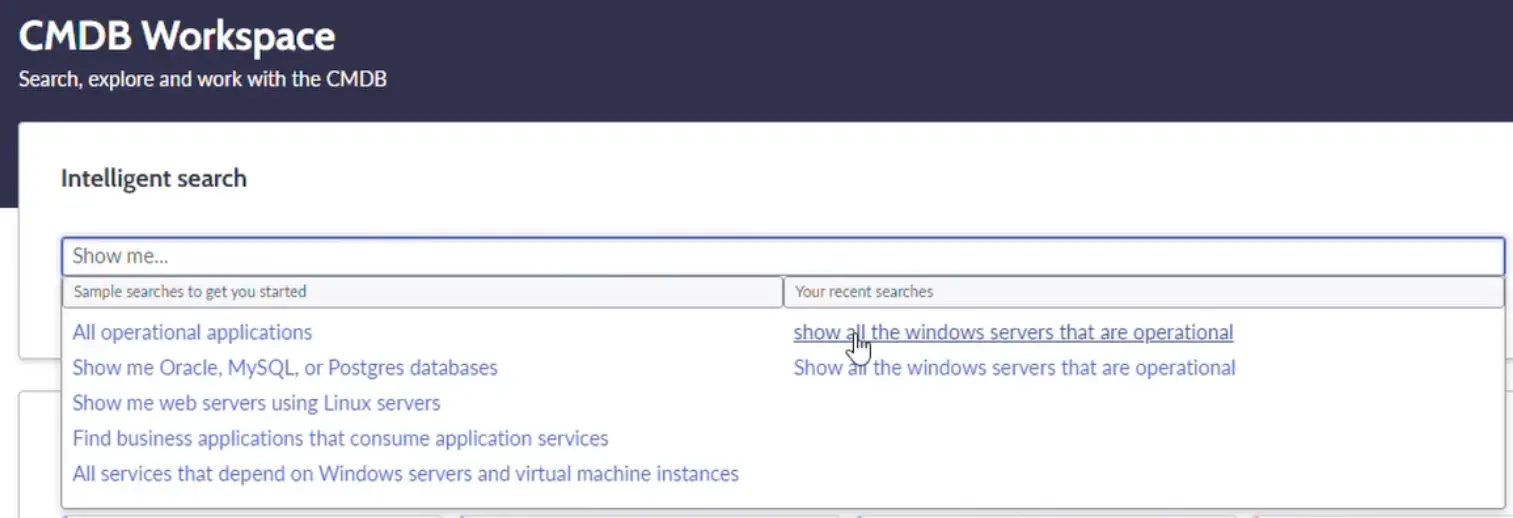
Examples:
show all operational Windows servers
linux servers without serial number
show me configuration items located in Oslo
show me all servers running Oracle database
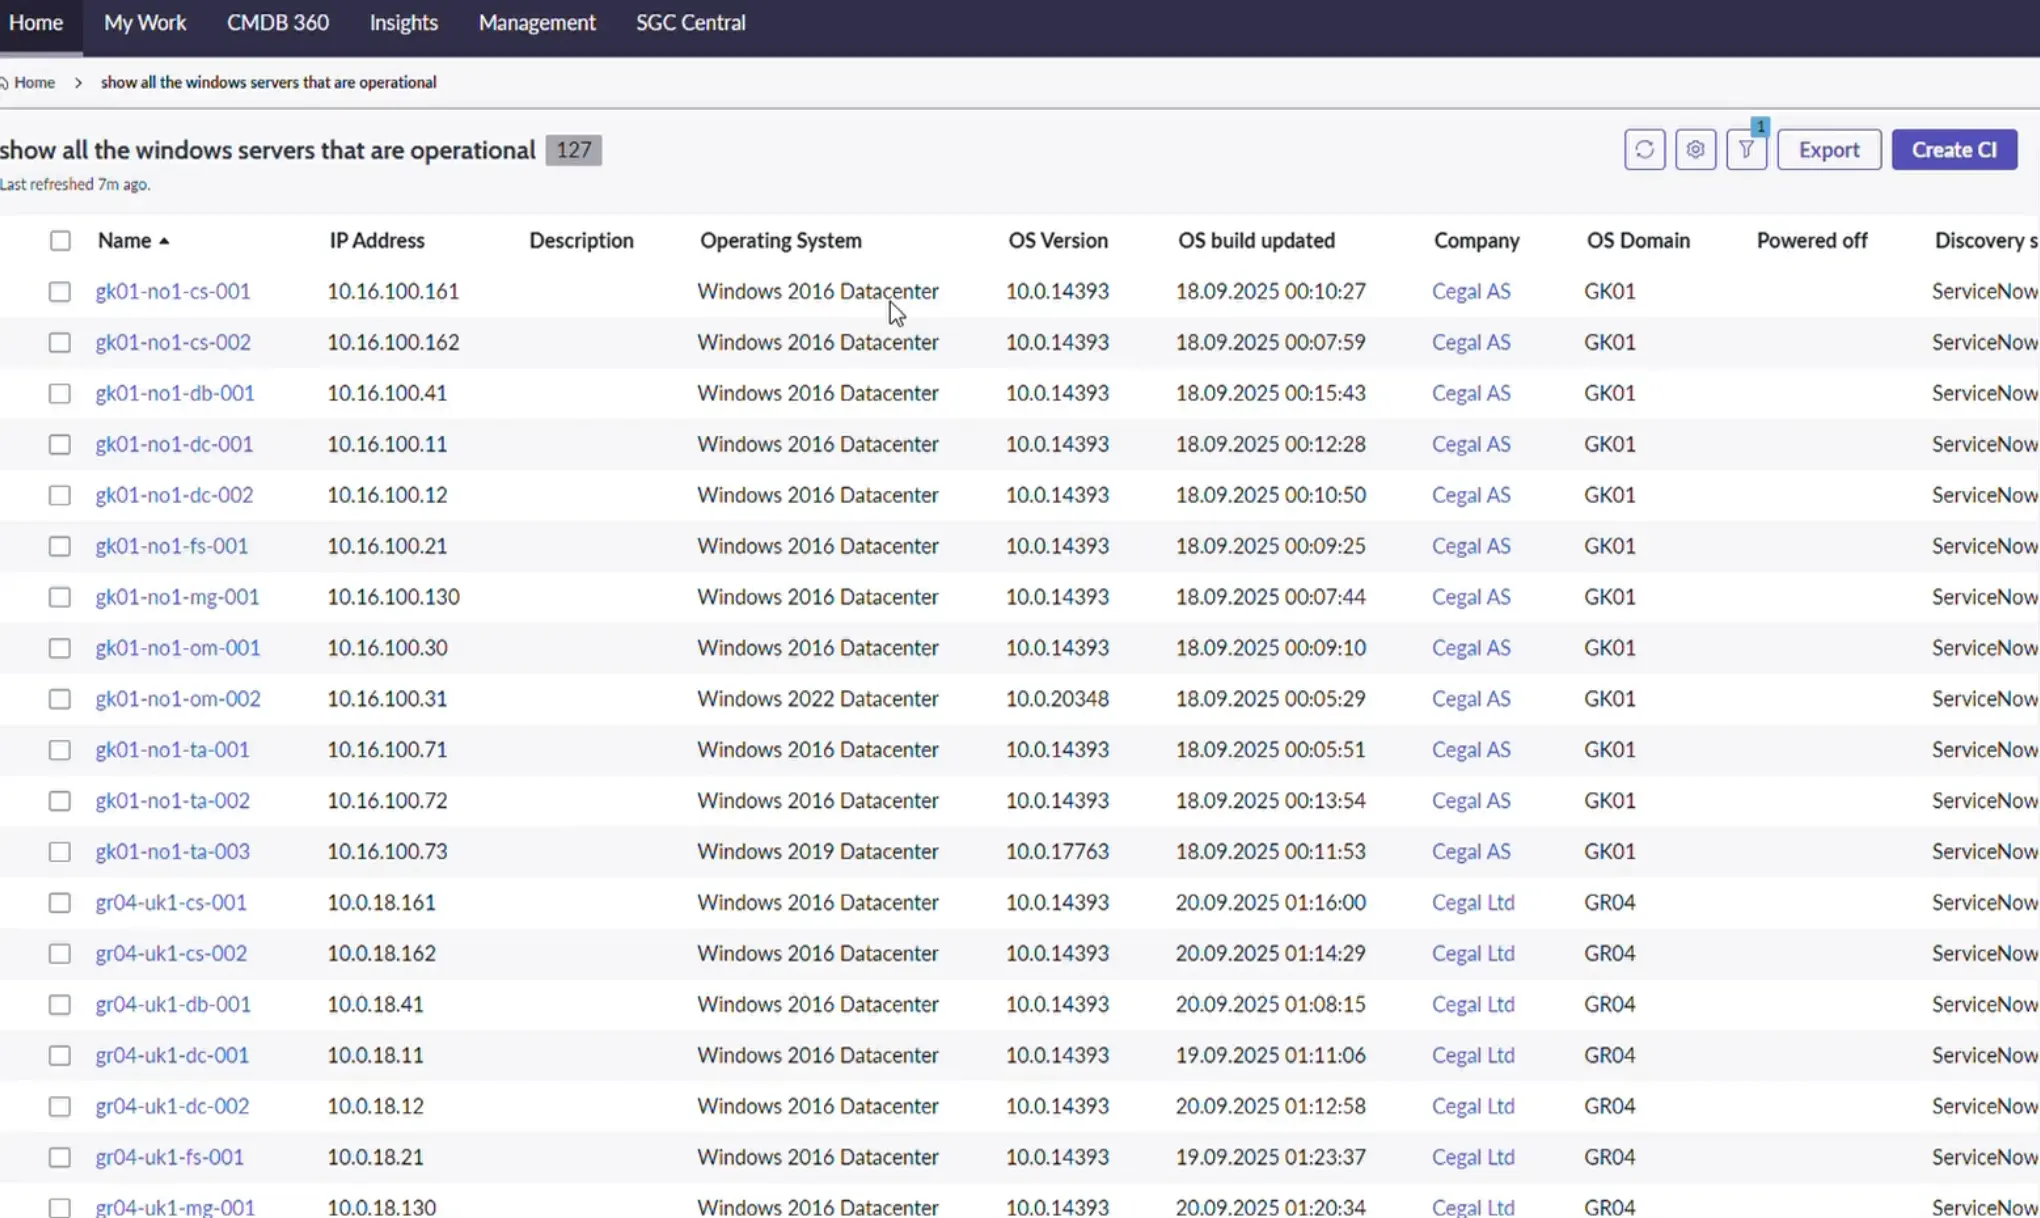
- Click a result to open CI details.
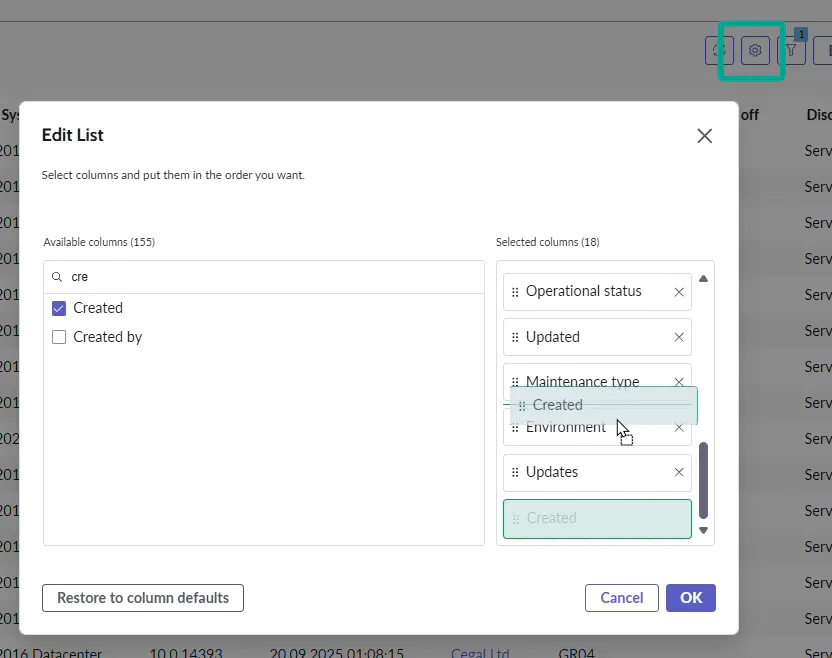
- Configure visible columns.
- Export results to Excel, CSV, JSON, or PDF; download or email directly.
Tip
See the Search tips for more examples and syntax help.
Important Actions
A prioritized list of CMDB health tasks assigned to you or your groups (e.g., duplicates to resolve).
For admins
Use this queue to drive daily/weekly hygiene work.
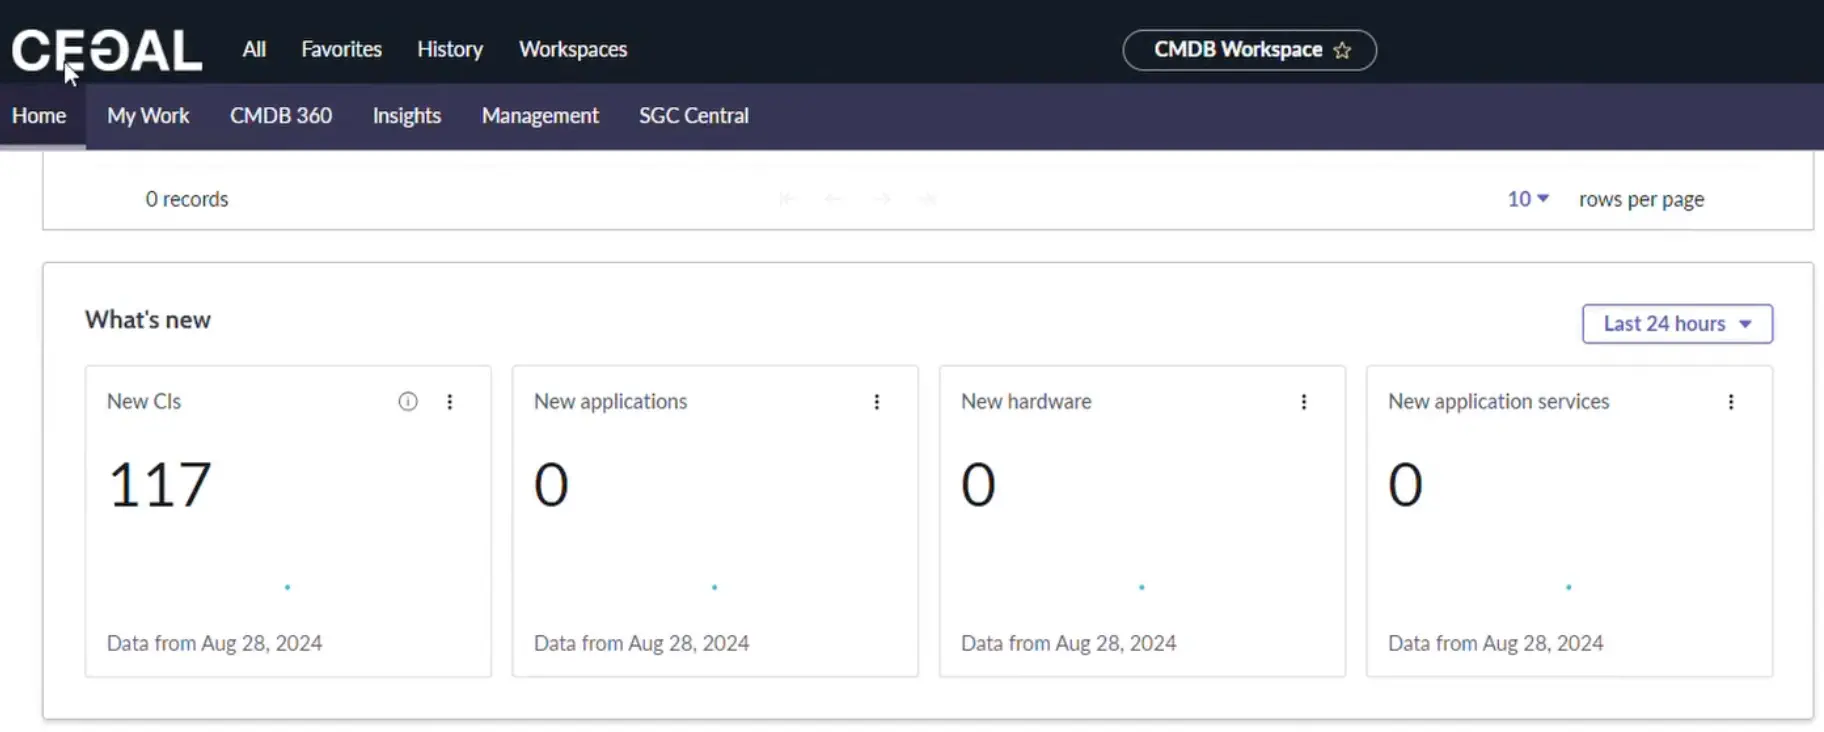
What’s New
See newly created CIs within a time window (Last 24h, 7 days, 30 days). Useful for ingestion monitoring and change awareness.
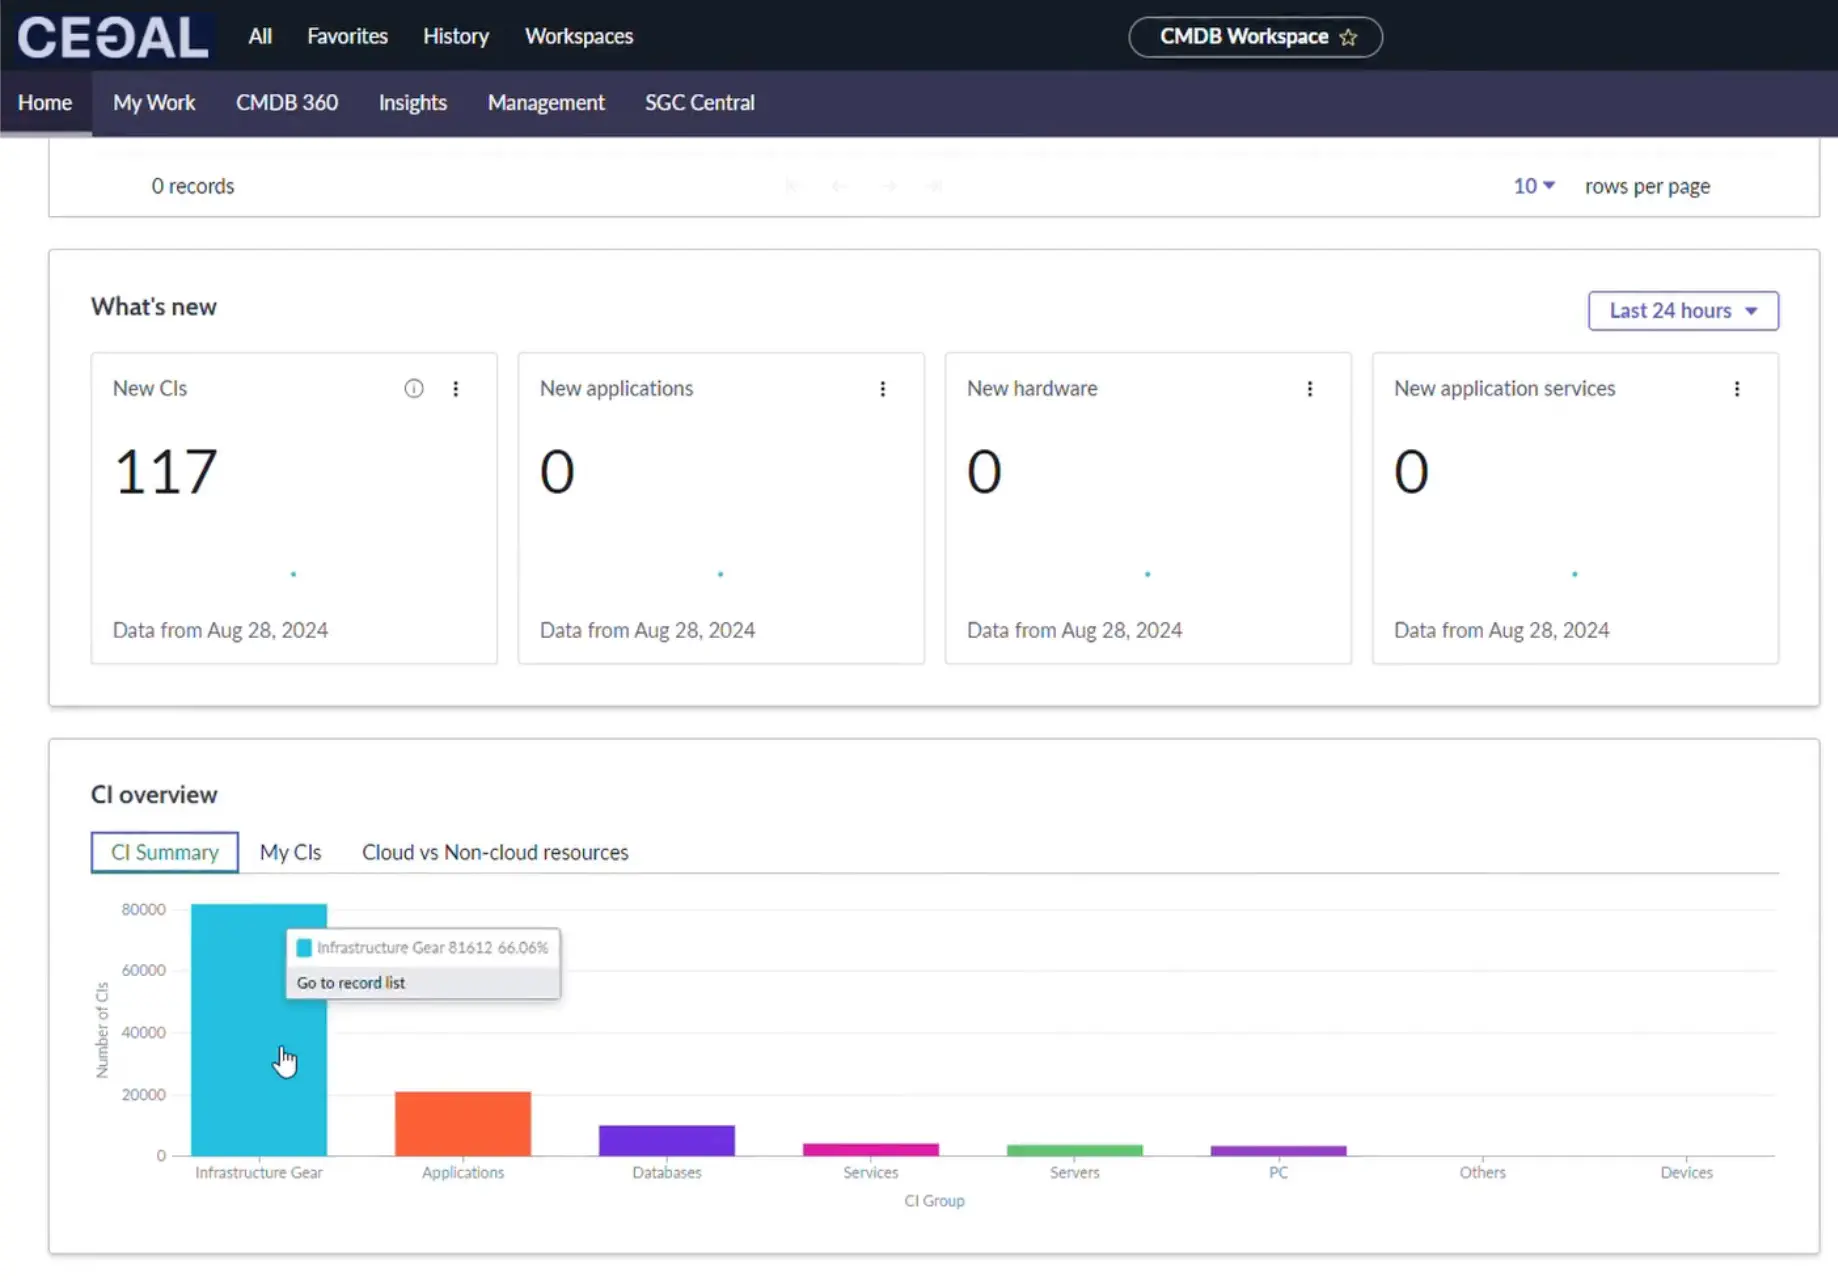
CI Overview
Tiles and charts that summarize your estate: Totals, CIs you manage, and Cloud vs Non-Cloud distribution.
Right-hand panel
A compact area with My Work and Quick Links to speed up navigation.
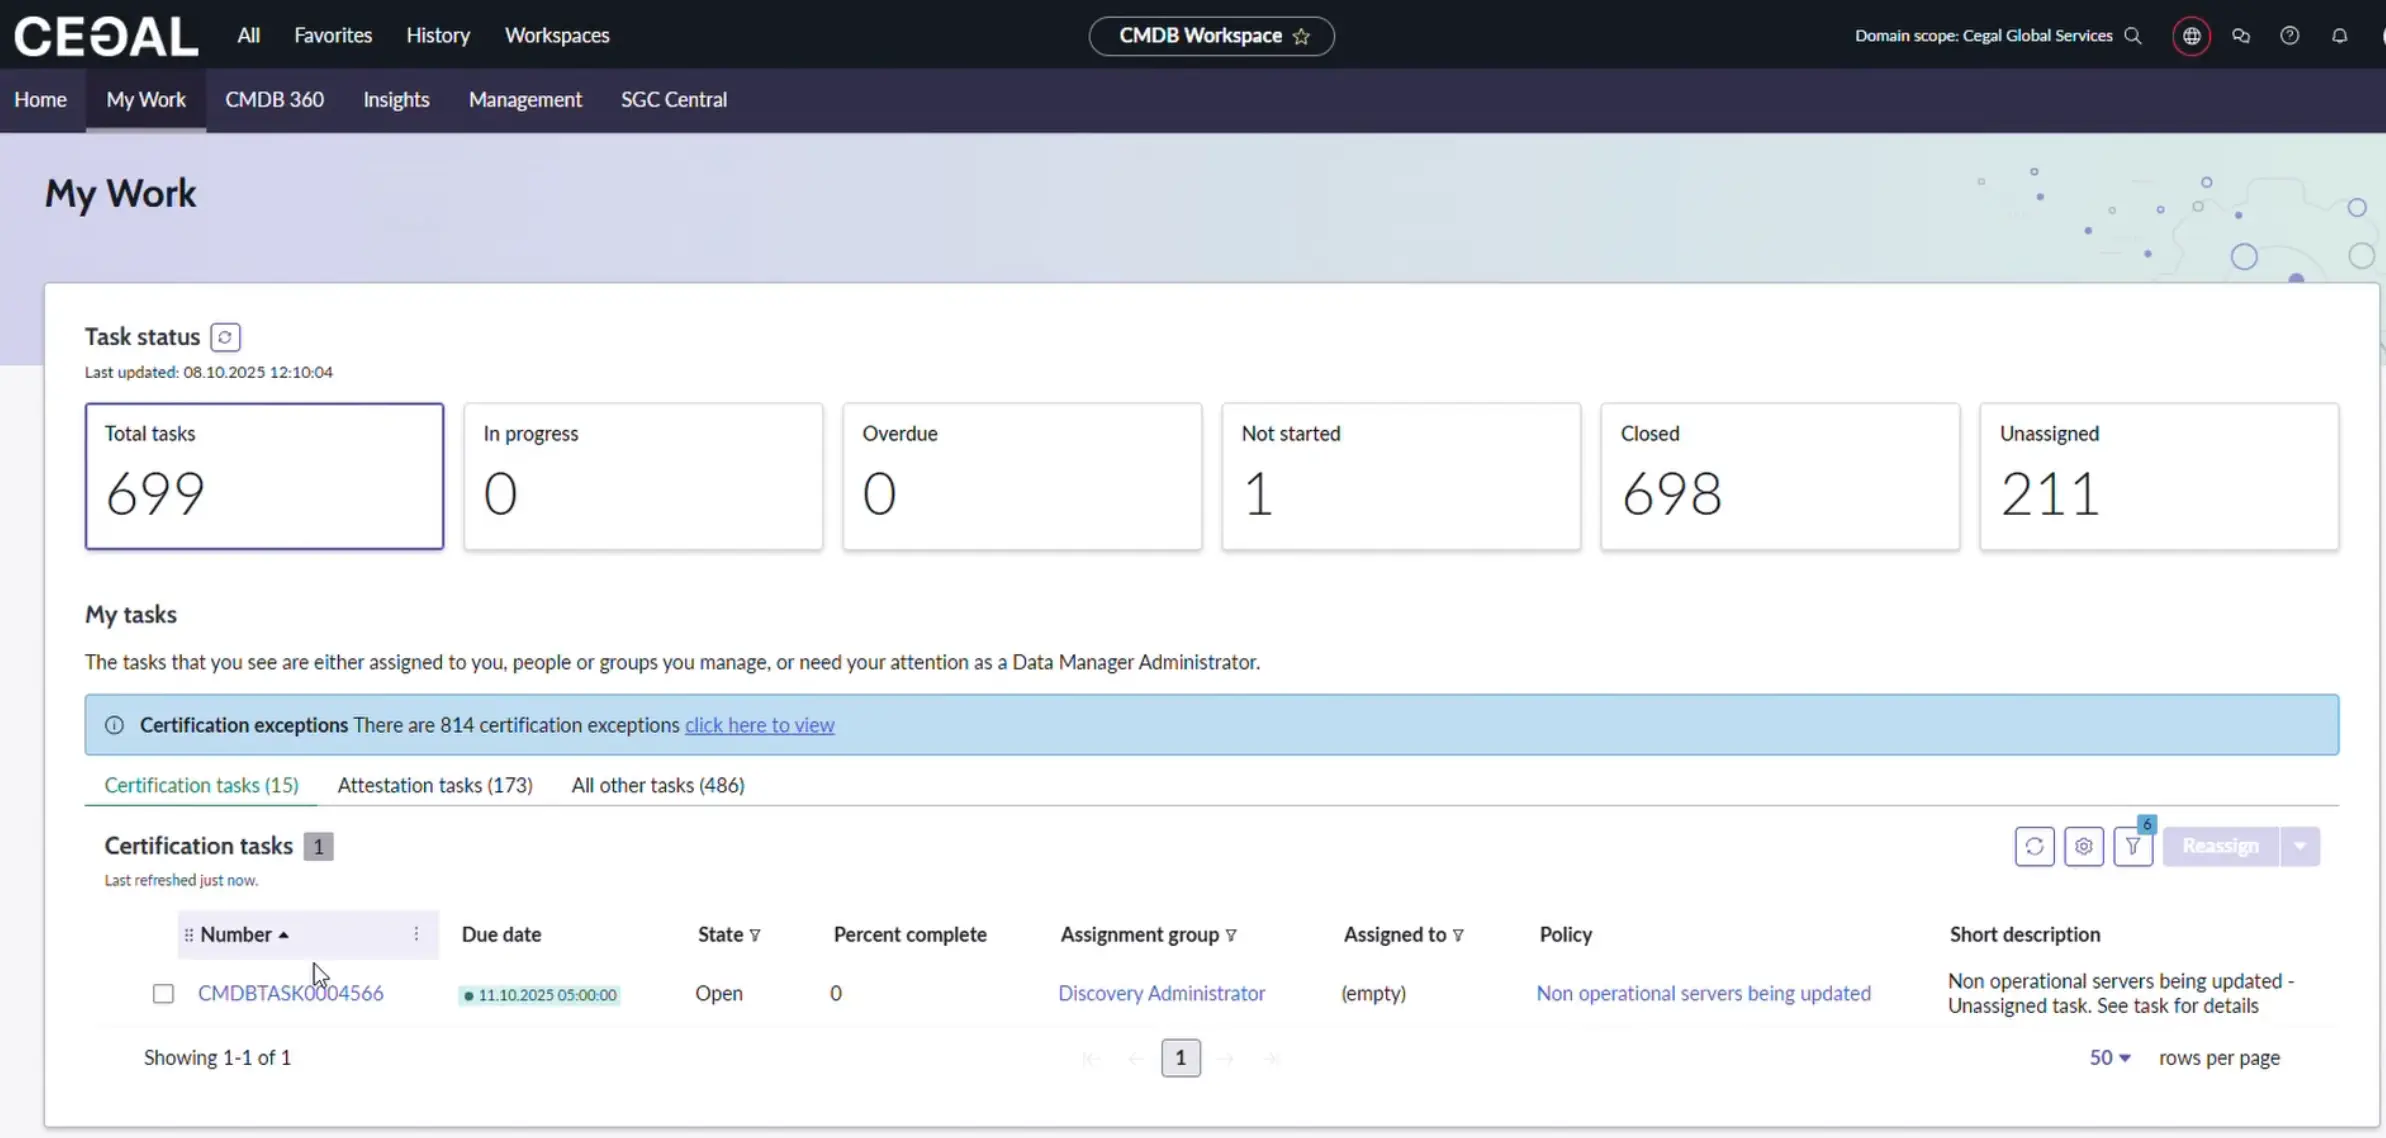
My Work
Lists tasks assigned to you/your group—typically health fixes and data certification work.

Tip
Triage daily; fix small issues quickly to prevent data debt.
Quick Links
| Link | What it’s for | Typical user |
|---|---|---|
| CI Class List | Browse/filter CI classes; customize columns; bulk export | Power users, admins |
| CMDB Health Dashboard | Track Completeness, Correctness, Compliance; drill down to issues | CMDB admins |
| Create CI | Manually create a CI (use with caution) | CMDB admins only |
| Data Certification Dashboard | Certify data accuracy; complete assigned reviews | CMDB admins |
| Dependency Views | Visualize CI relationships and topology | Ops & CMDB admins |
| Query Builder | Build complex cross-class queries without code | Power users |
| Relationship Health Dashboard | Detect duplicate/orphan/stale relationships & rule compliance | CMDB admins |
| Unified Map | One-page CI timeline and context: attributes, services, tasks, changes | All power users |
Warning — Create CI
Manual CI creation can bypass discovery and reconciliation. Use only when required, following local governance. Prefer automated discovery and connectors where possible.
Key tools in depth
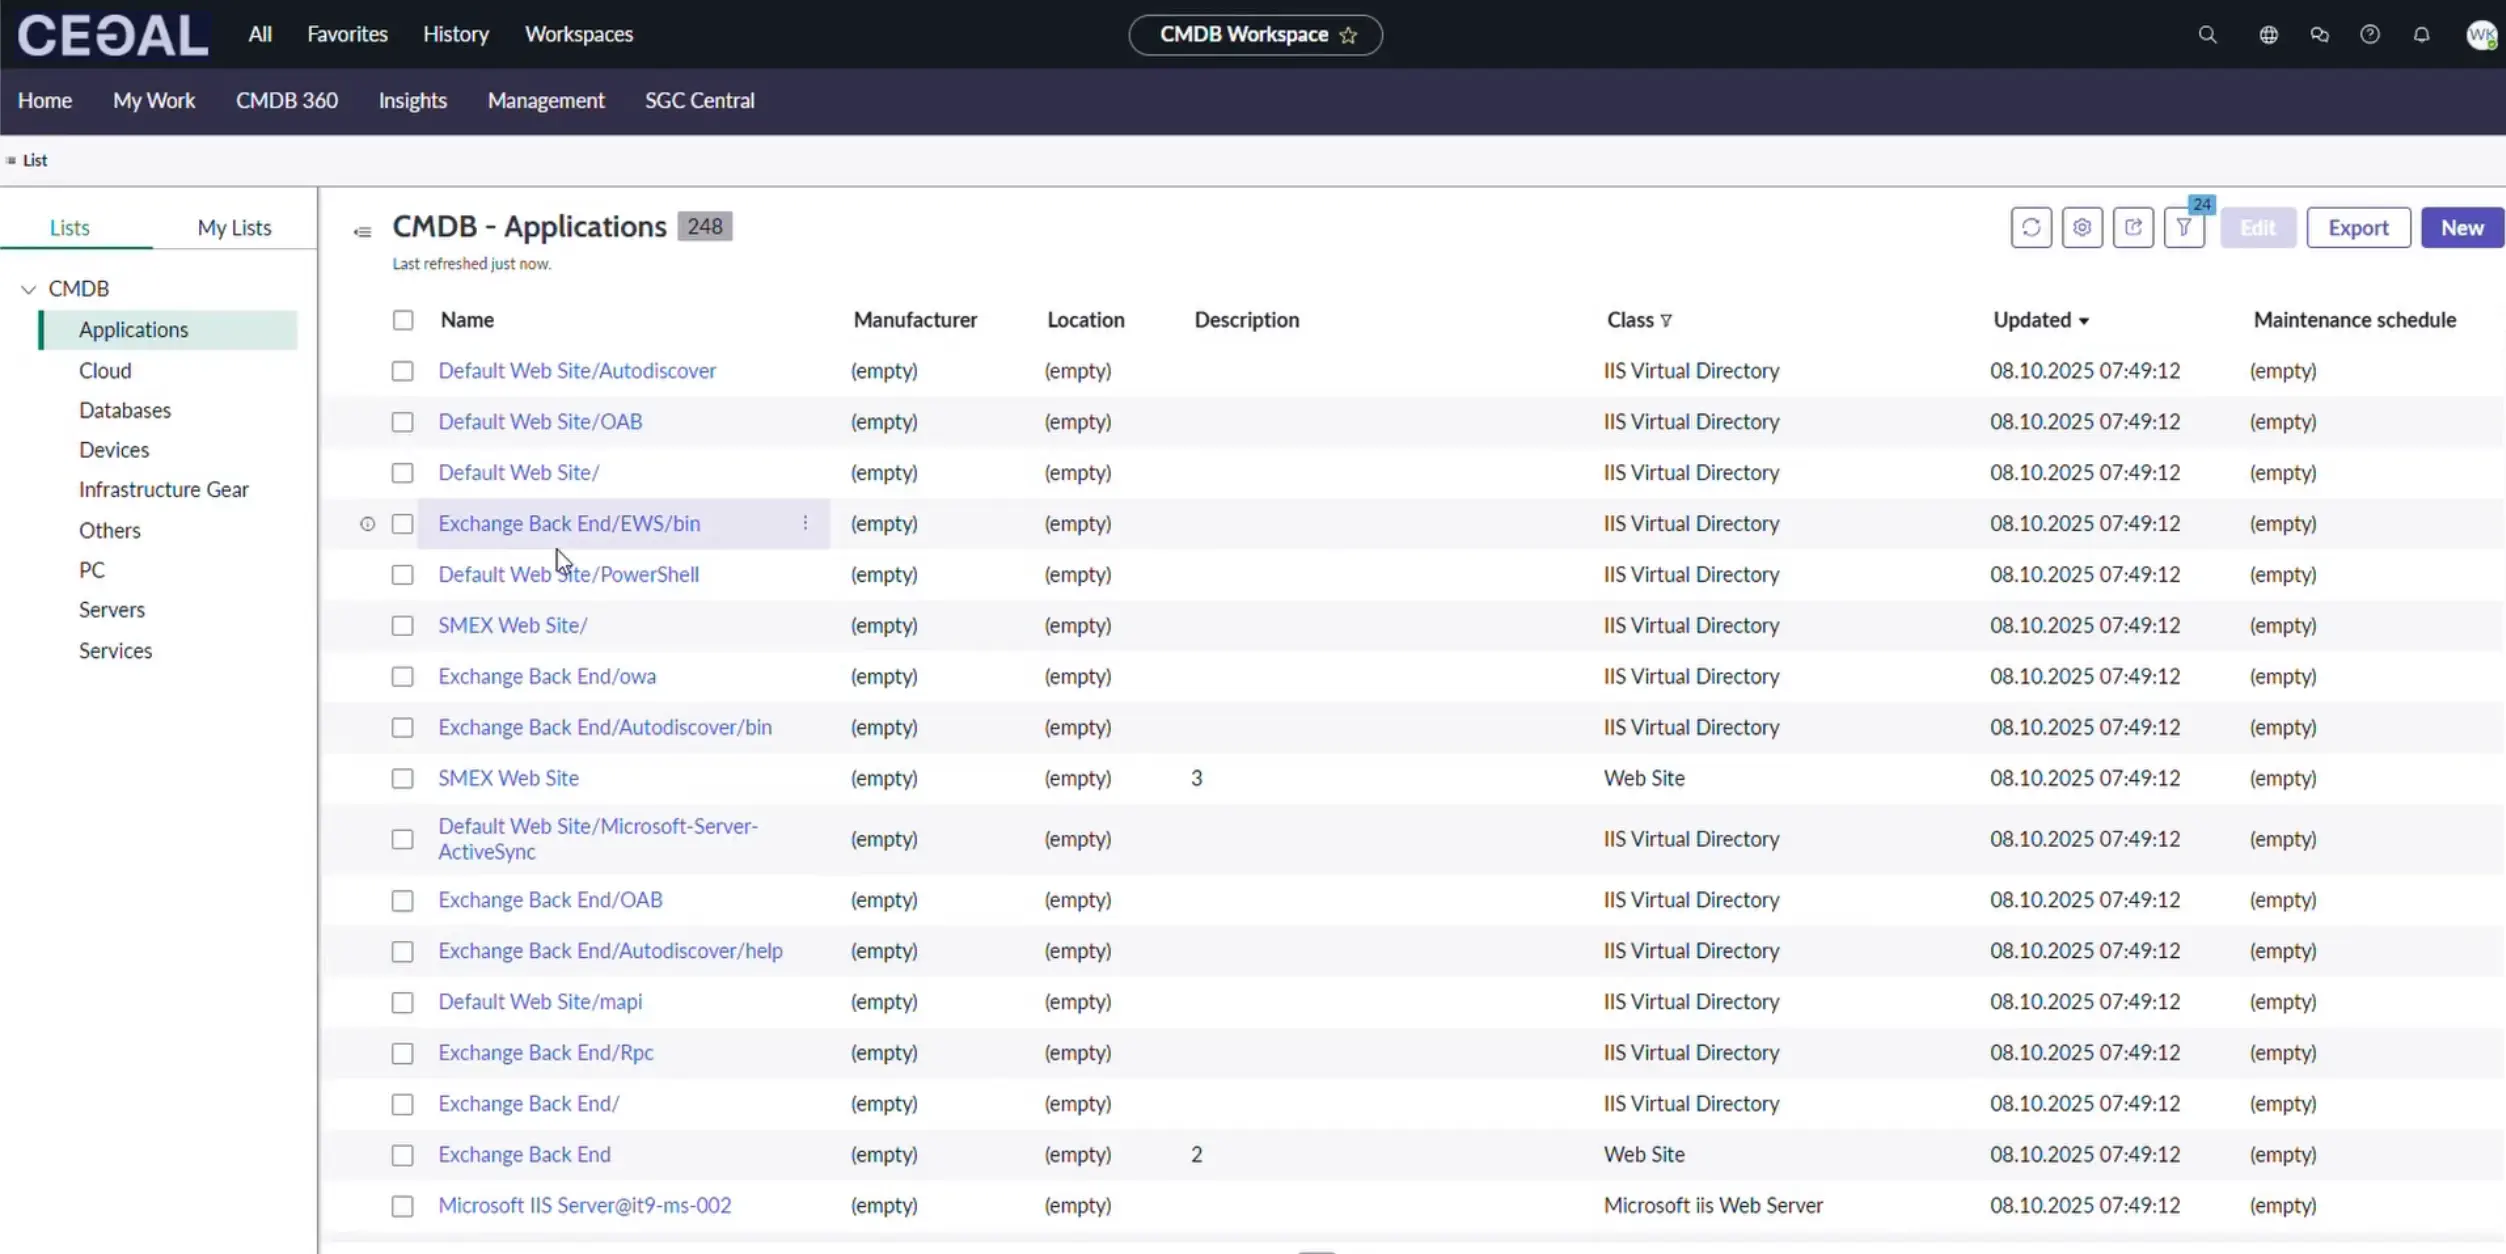
CI Class List
- Navigate across classes (e.g., Servers → Windows/Linux/ESX/AIX).
- Add/remove columns to focus on data health fields (owner, serial, environment, etc.).
- Filter by class, status, location, assignment group, Discovery Source.
- Export results for audits or bulk reviews.
Best practice
Save a “Data Health” view per class showing critical attributes and ownership.
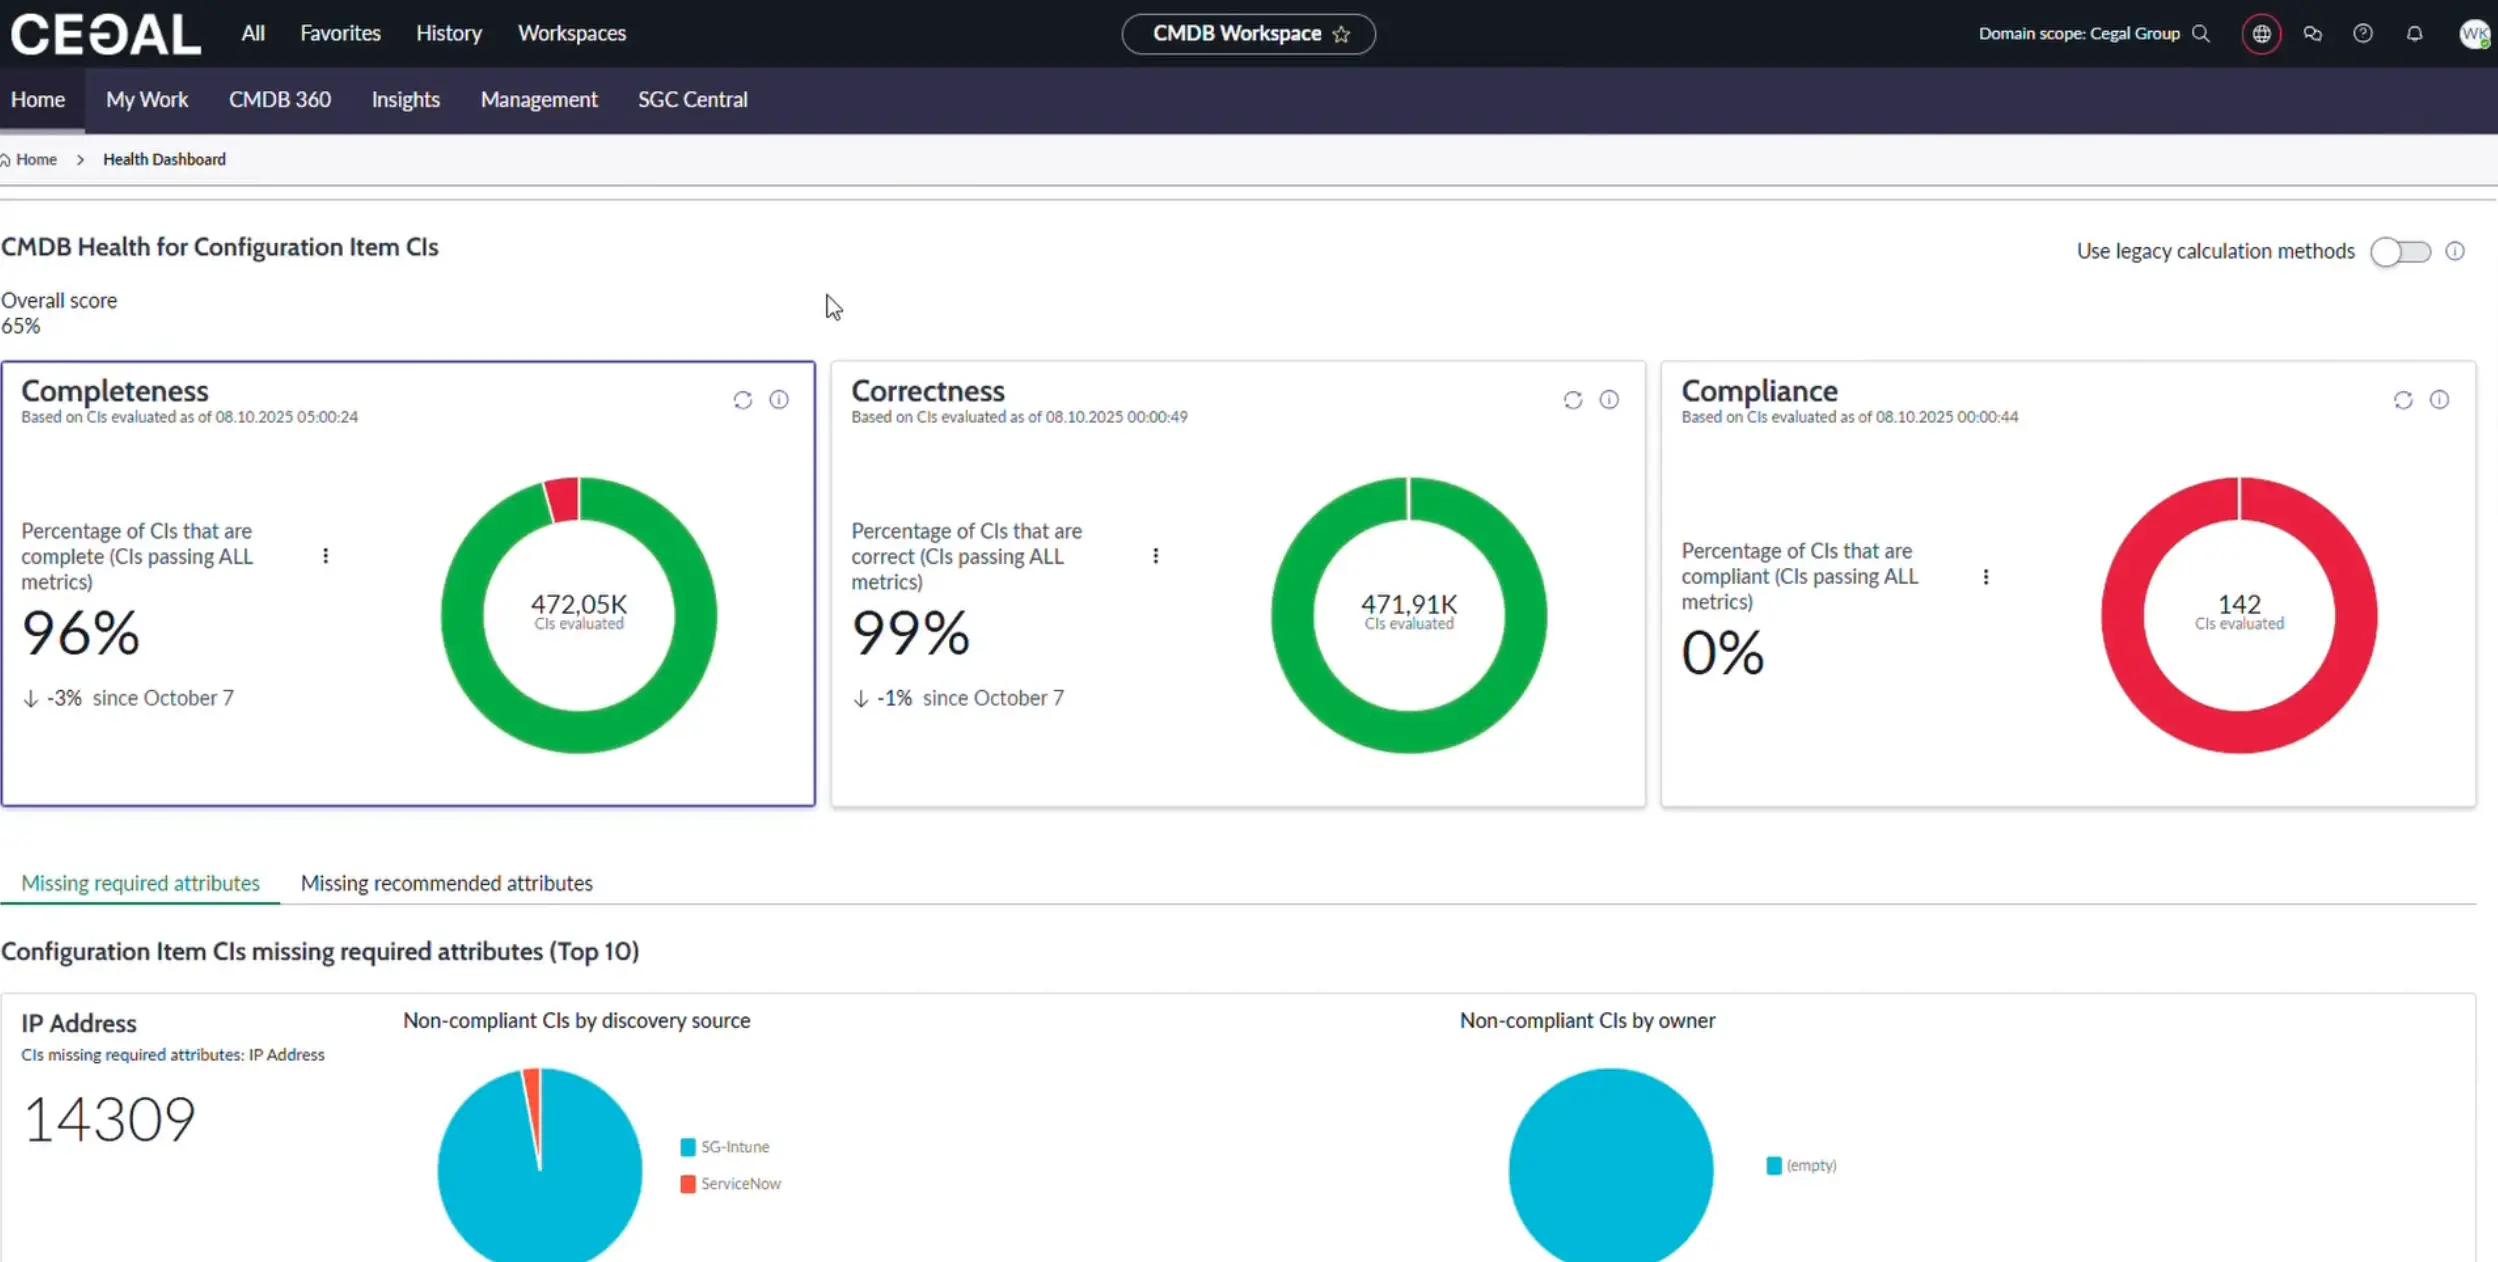
CMDB Health Dashboard
Health is measured across three dimensions:
- Completeness — missing required/recommended attributes
- Correctness — duplicate, orphan, stale CIs
- Compliance — adherence to audit policies/jobs (e.g., Windows/Linux)
Click any score to open the CMDB Health Dashboard for drill-down, remediation guidance, and trend charts.
Tip
Track trends weekly. Focus first on high-impact classes (Servers, Application Services, Network Devices).
Data Certification Dashboard
Shows certification tasks assigned to you. Use it to confirm accuracy of specific fields per class on a schedule.
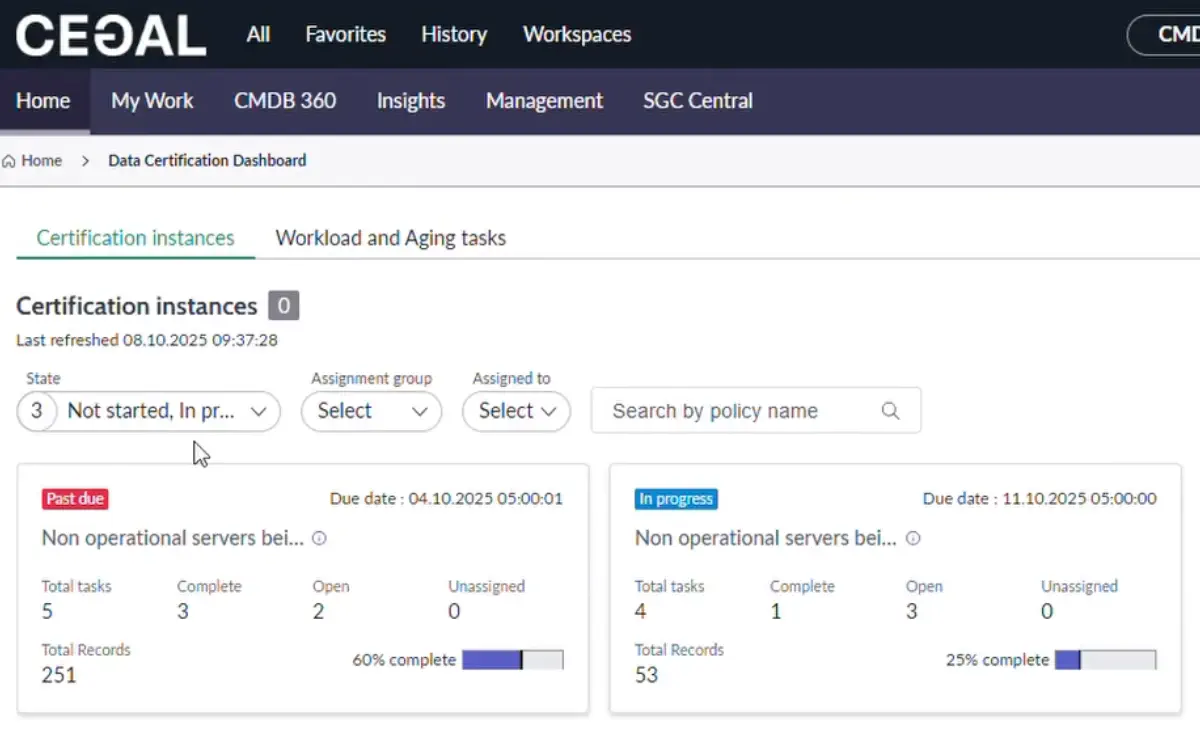
Note
Usually driven by CMDB governance; admins assign scope and cadence.
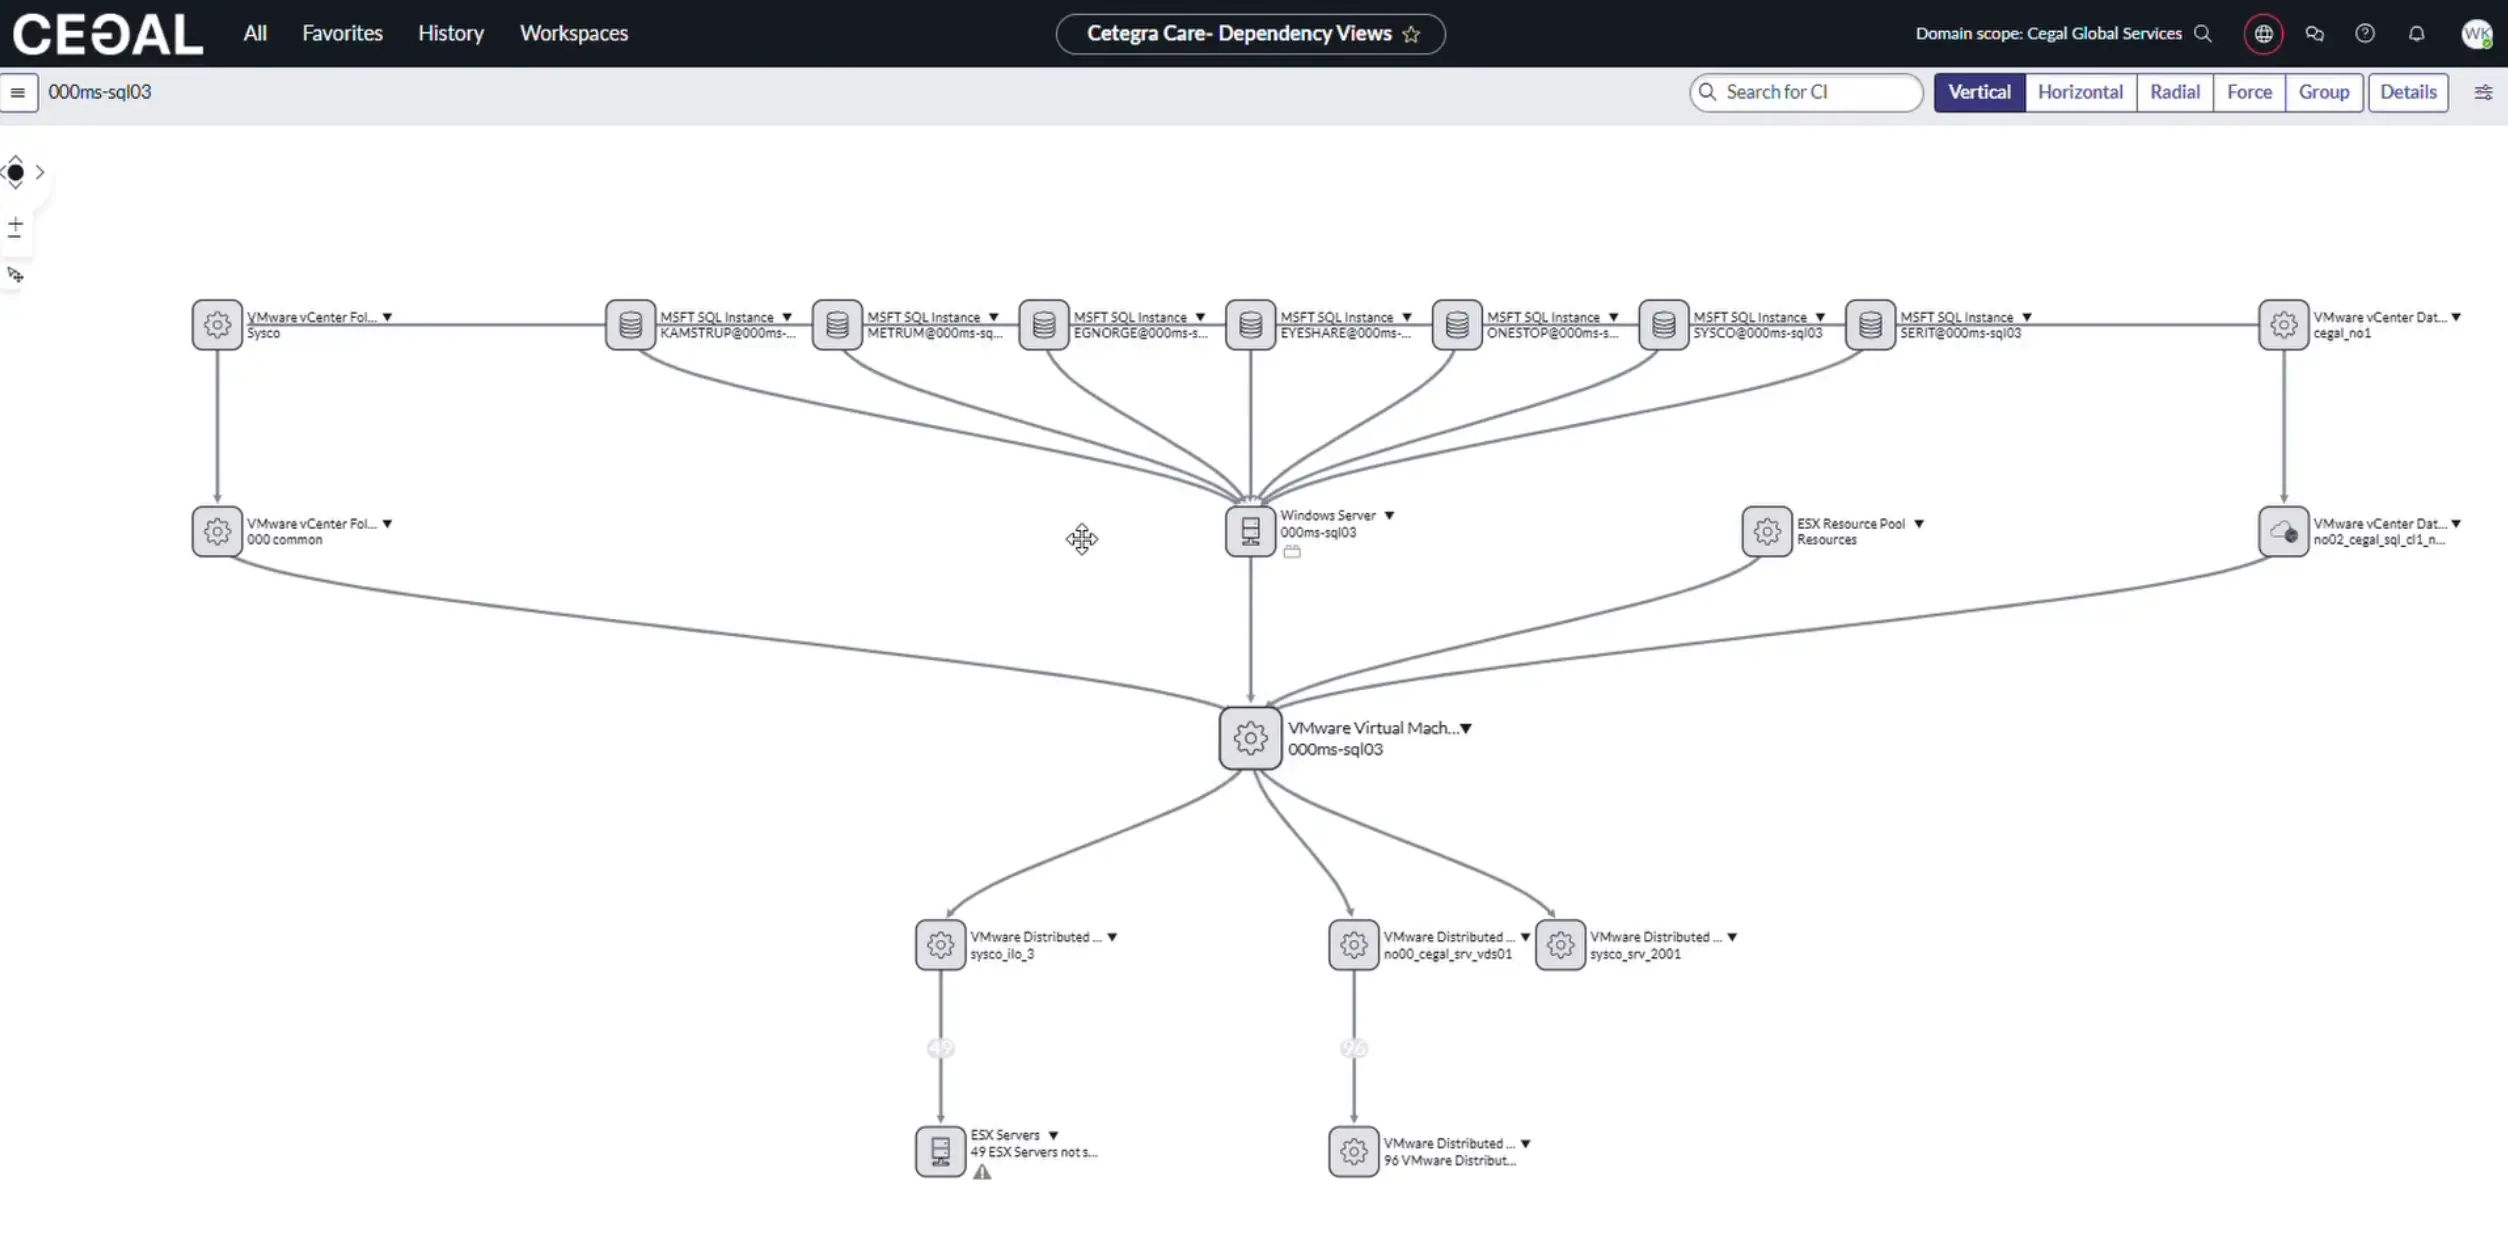
Dependency Views (Topology)
Explore graphical relationships between CIs:
- Search a CI, then open its topology.
- Set levels (e.g., 2–3 hops), choose relationship types (Runs on, Depends on, Hosted on, etc.).
- Use filters to isolate technology domains or environments.
Shortcut
From any CI record, open its Dependency map directly—no need to navigate via Quick Links.
Query Builder
Build multi-class queries visually (no code):
Common patterns:
- Virtual → Physical: Virtual servers with their physical hosts
- Completeness checks: Servers missing
serial_numberorowner - Environment slices: Application Services in
Prodwith critical dependencies
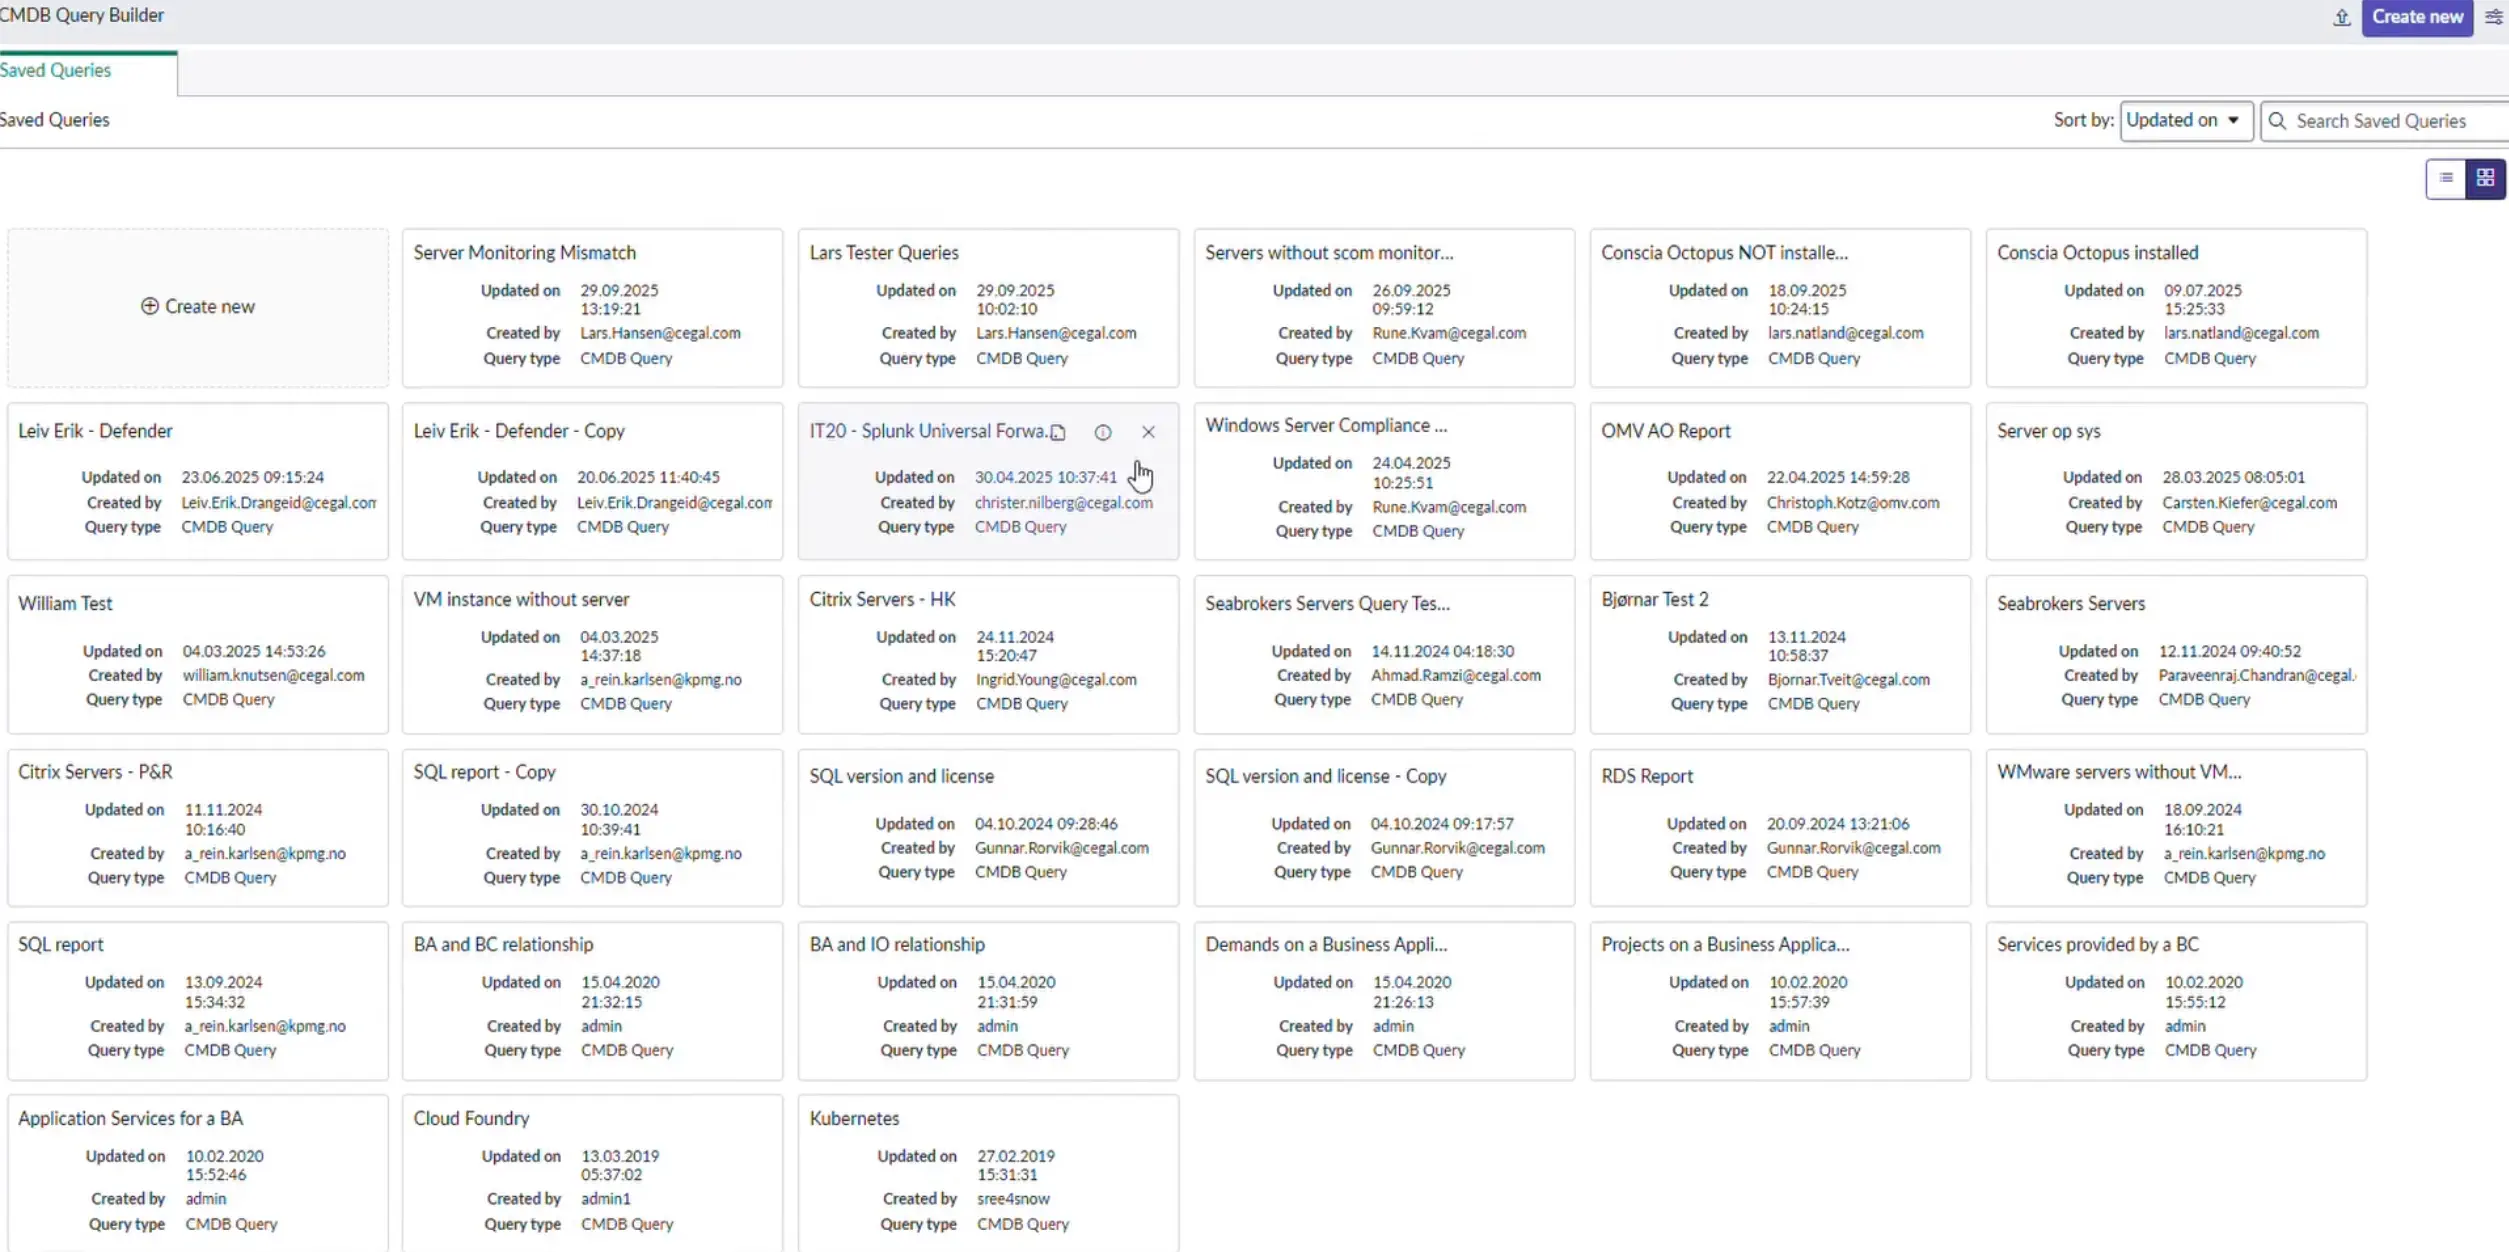
Pro tip
Save and name queries by purpose (e.g., “Compute: Windows Ops – Missing Owners”).
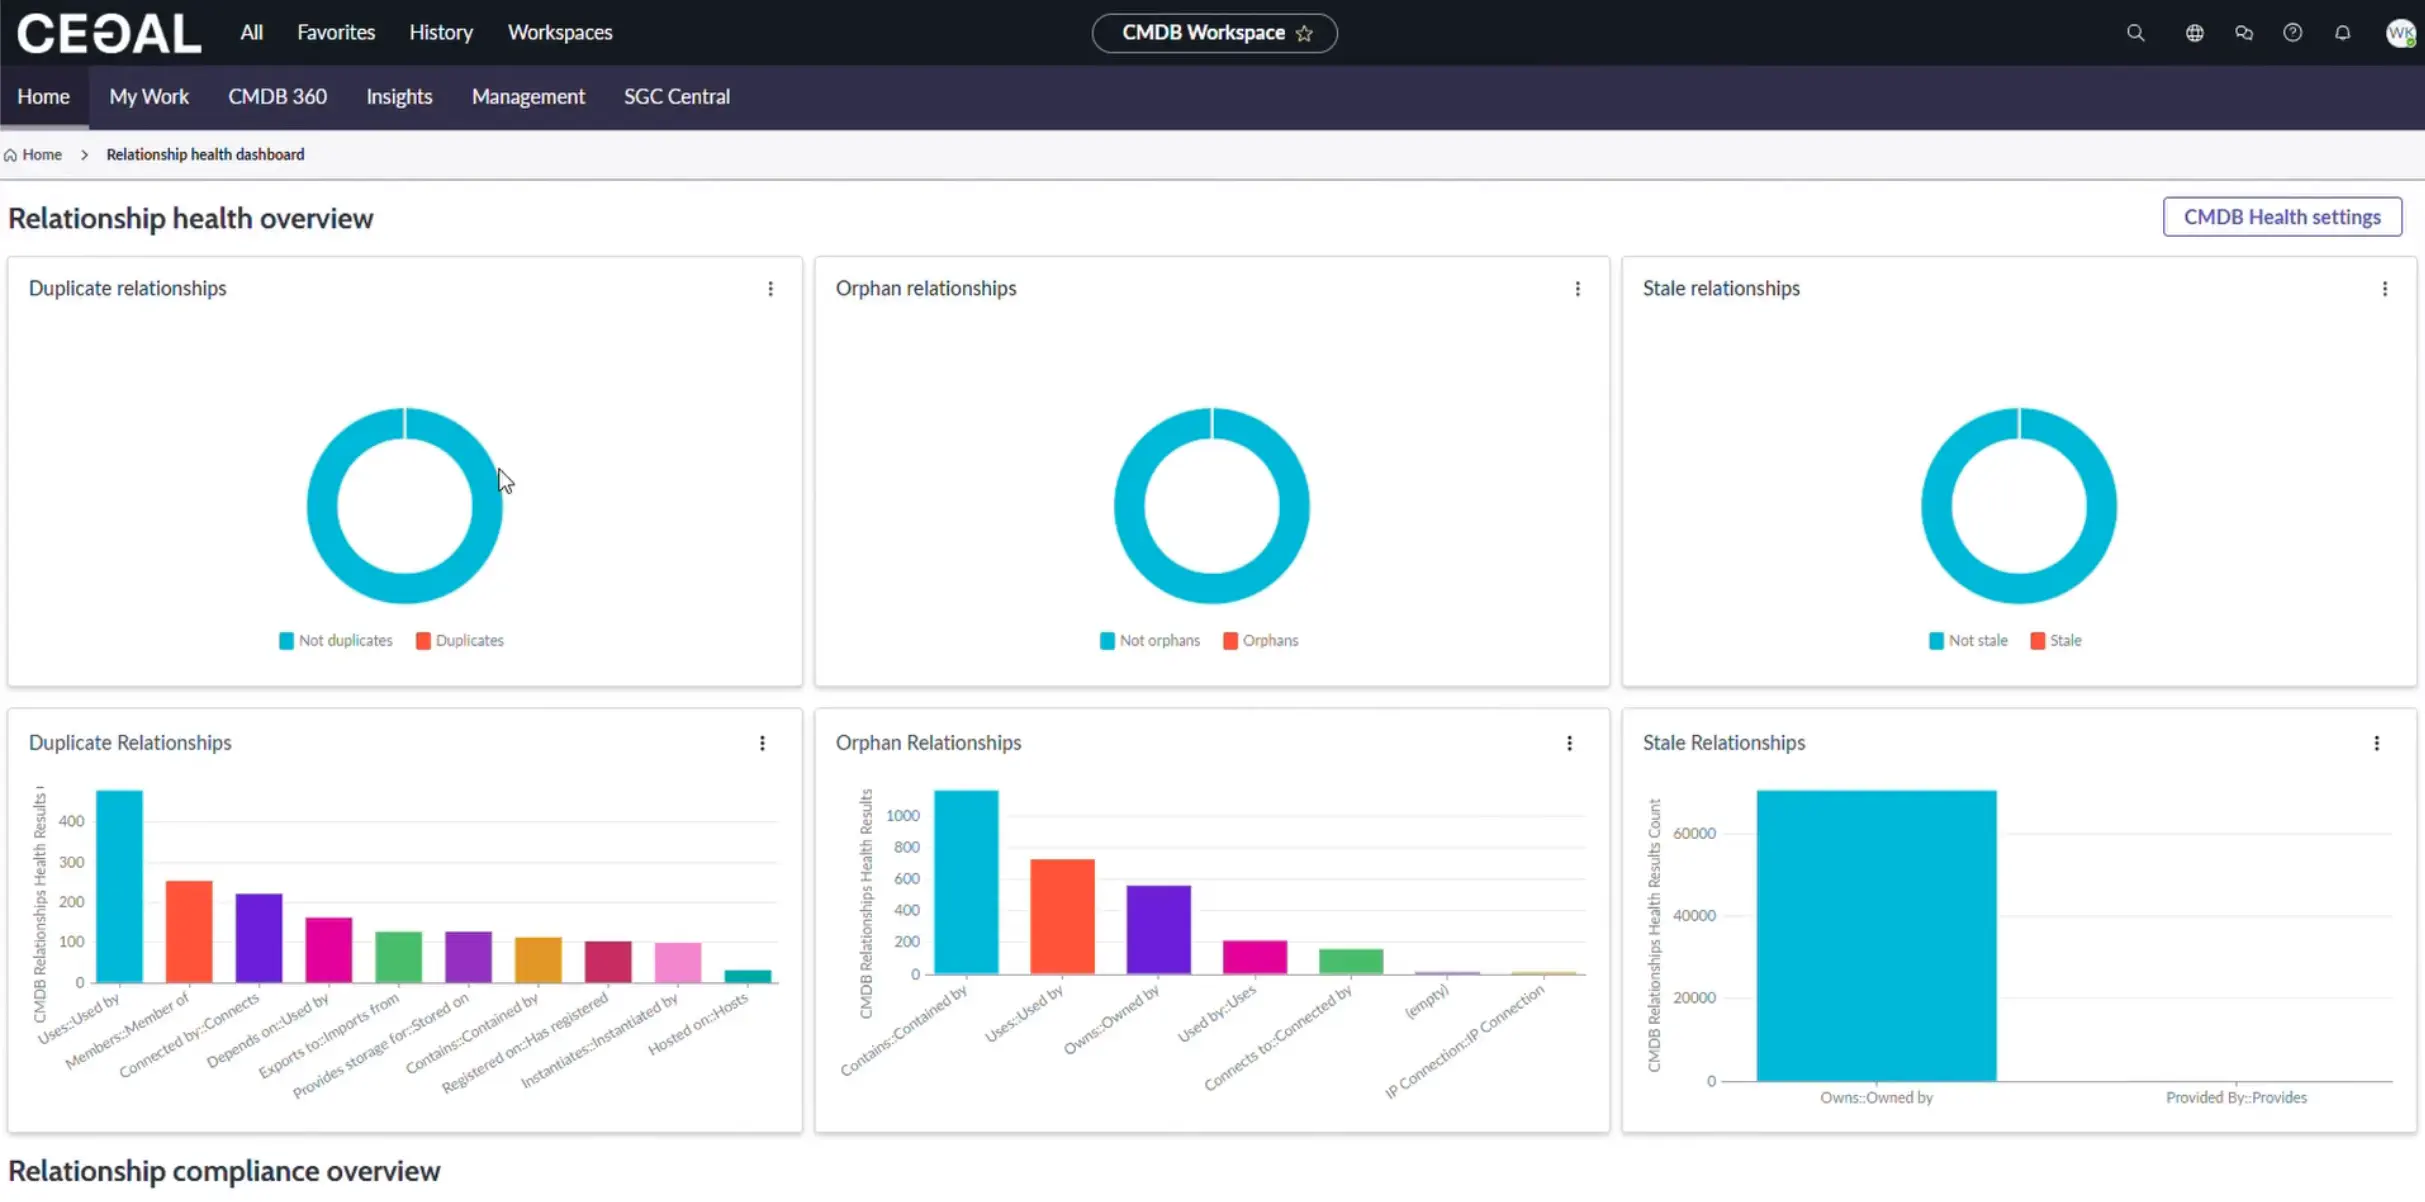
Relationship Health Dashboard
Detect and fix bad relationships:
- Duplicate: Multiple edges representing the same link
- Orphan: Relationships referencing missing CIs
- Stale: Outdated links not seen by discovery recently
- Compliance: Validates against allowed relationship rules
Unified Map
A single screen for CI context and history:
- Overview: CI name & type, related CI counts & types, connection counts, discovery sources
- Attributes: Key/value attributes
- Application Services: Linked services and business context
- Related Items: Tasks by type and counts
- Changes: Configuration changes over time
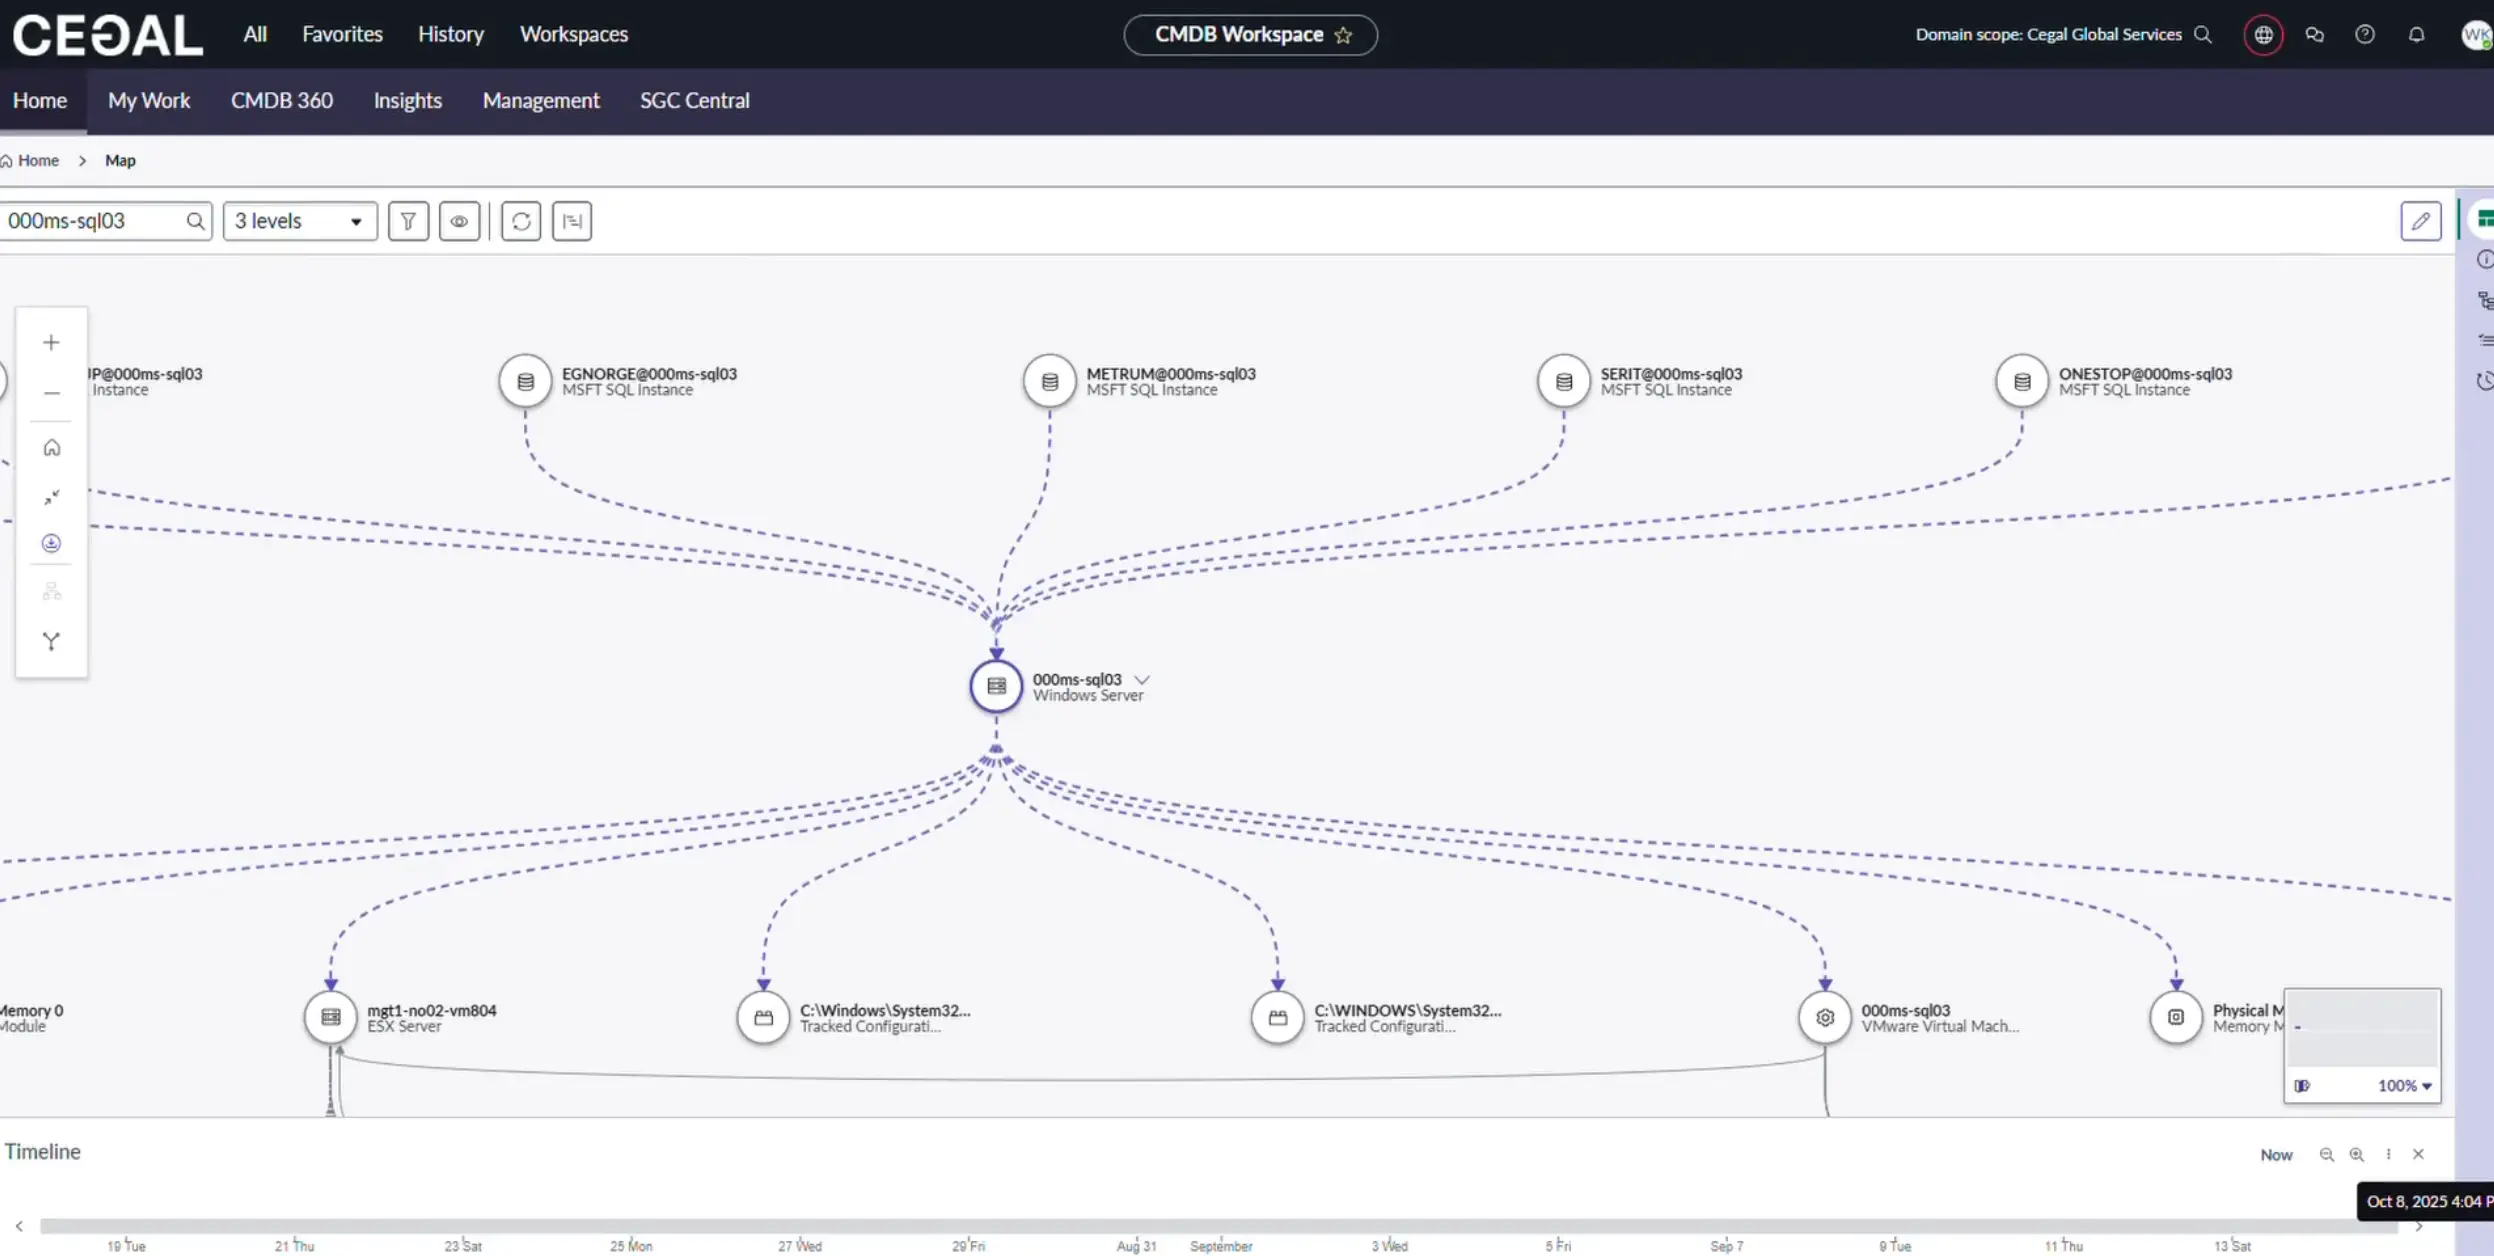
Use case
Perfect for incident triage and change impact assessment.
Tabs beyond Home
My Work tab
A consolidated list of CMDB tasks assigned to you/your groups: health fixes, certifications, and hygiene work.
CMDB 360 tab
Deep analytics across completeness, discovery coverage, and reconciliation.
- Potential Issues: CIs not reported by discovery sources or with data mismatch
- Saved Query: Build CMDB 360 queries to find data, find gaps, and compare attributes
- Discovery Sources: Count of sources, total 360 records, reconciled CIs; single-source vs multi-source distribution
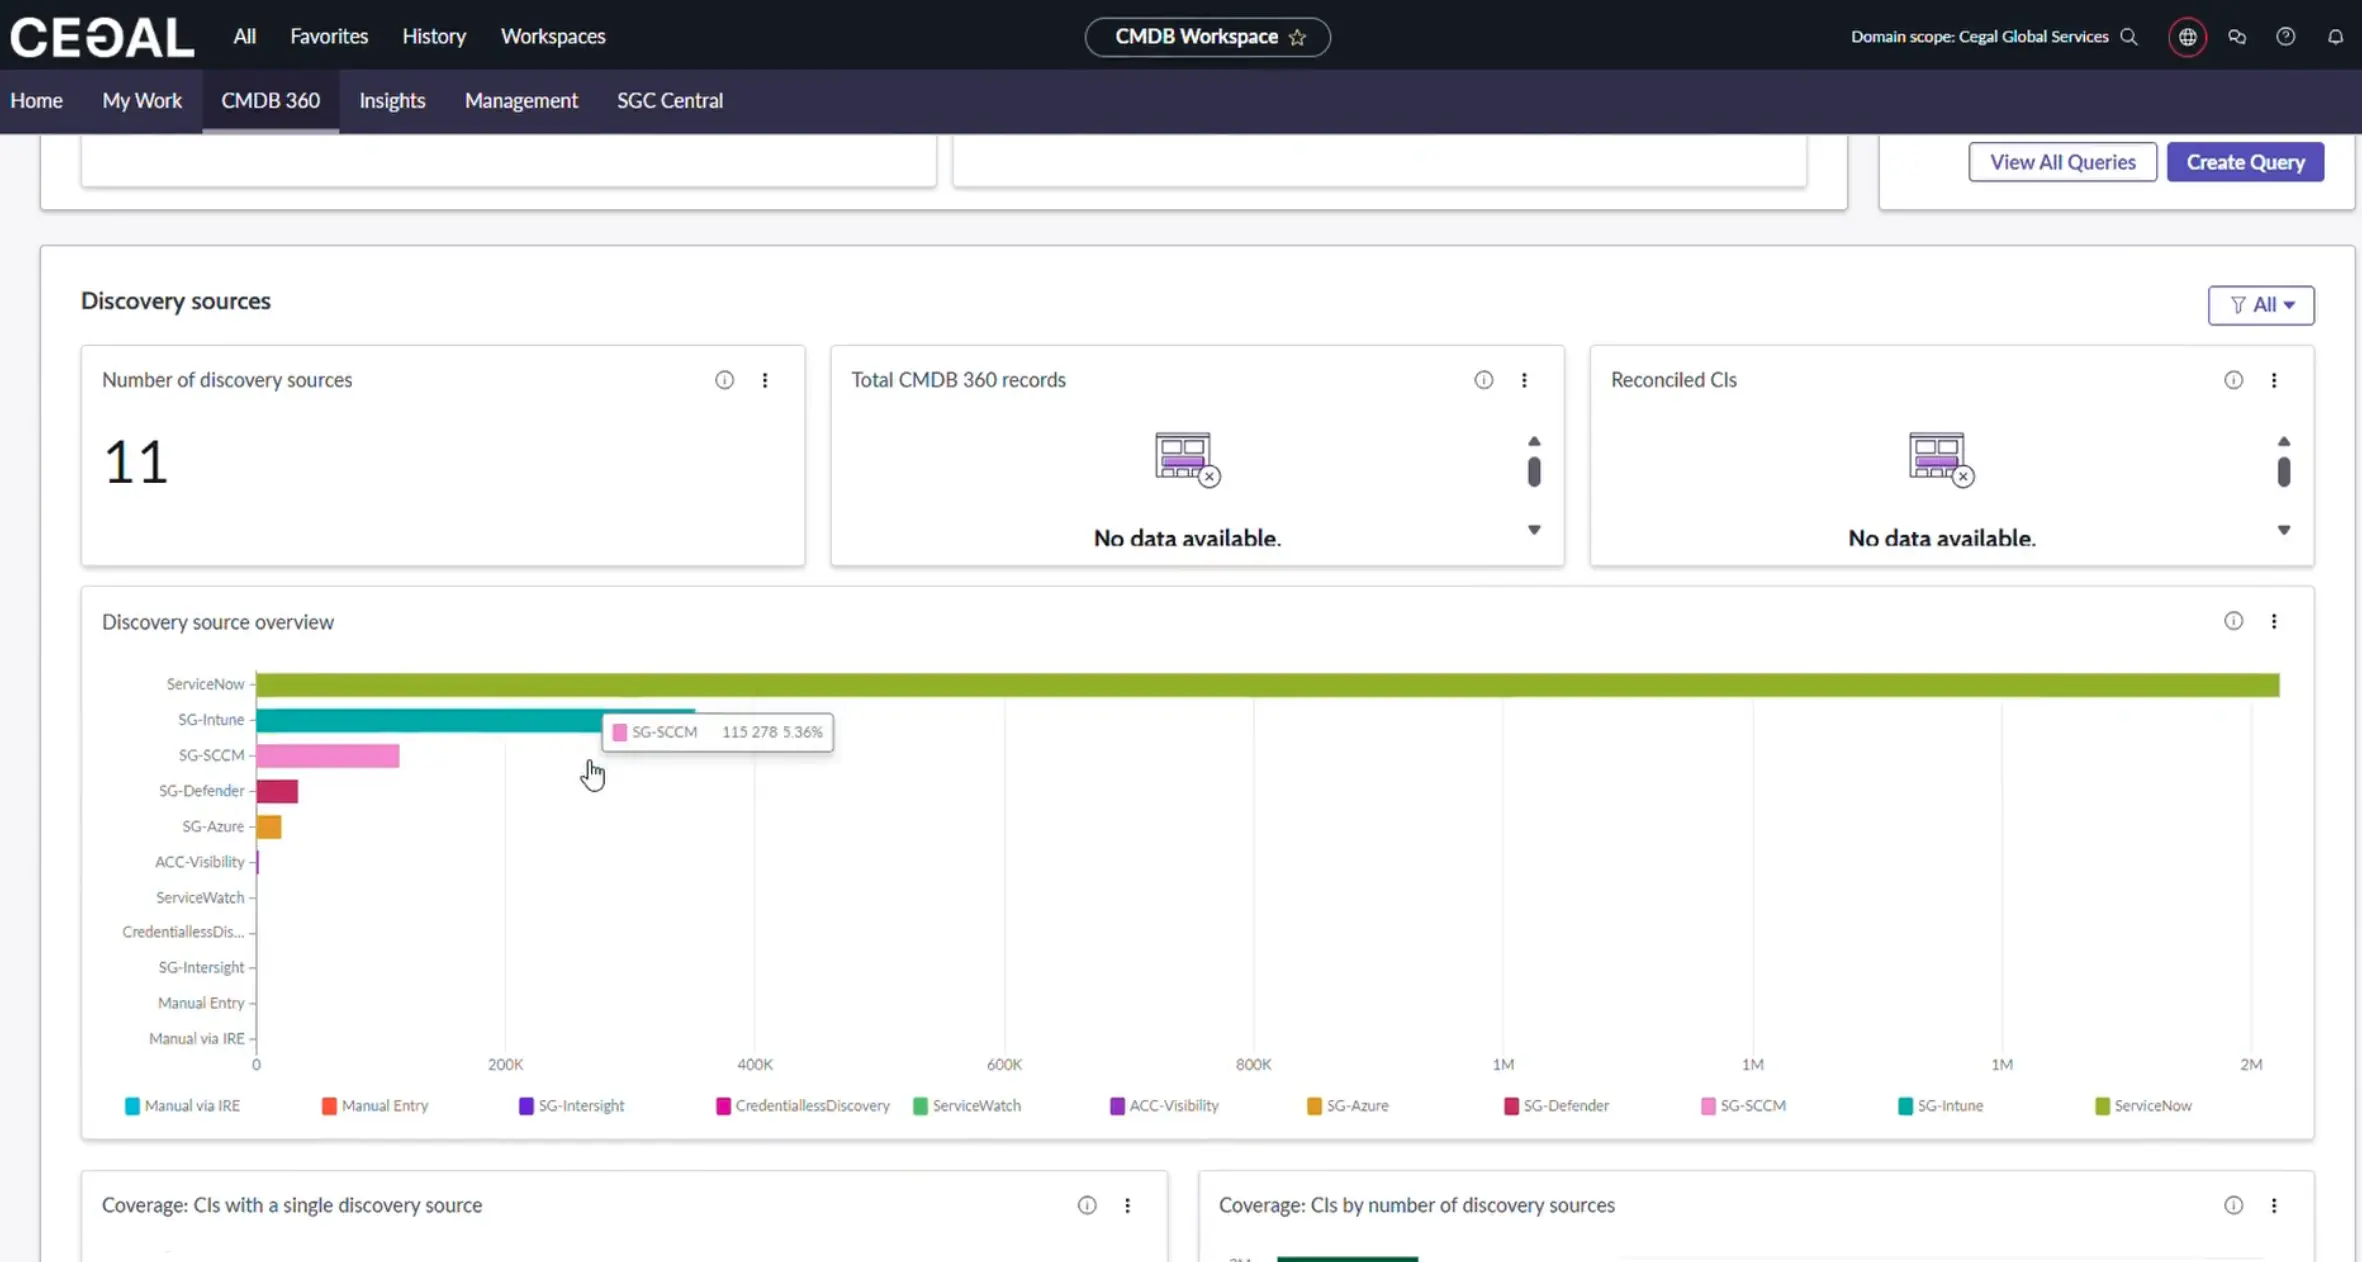
Tip
Prioritize classes with low coverage or single-source CIs that should be multi-sourced.
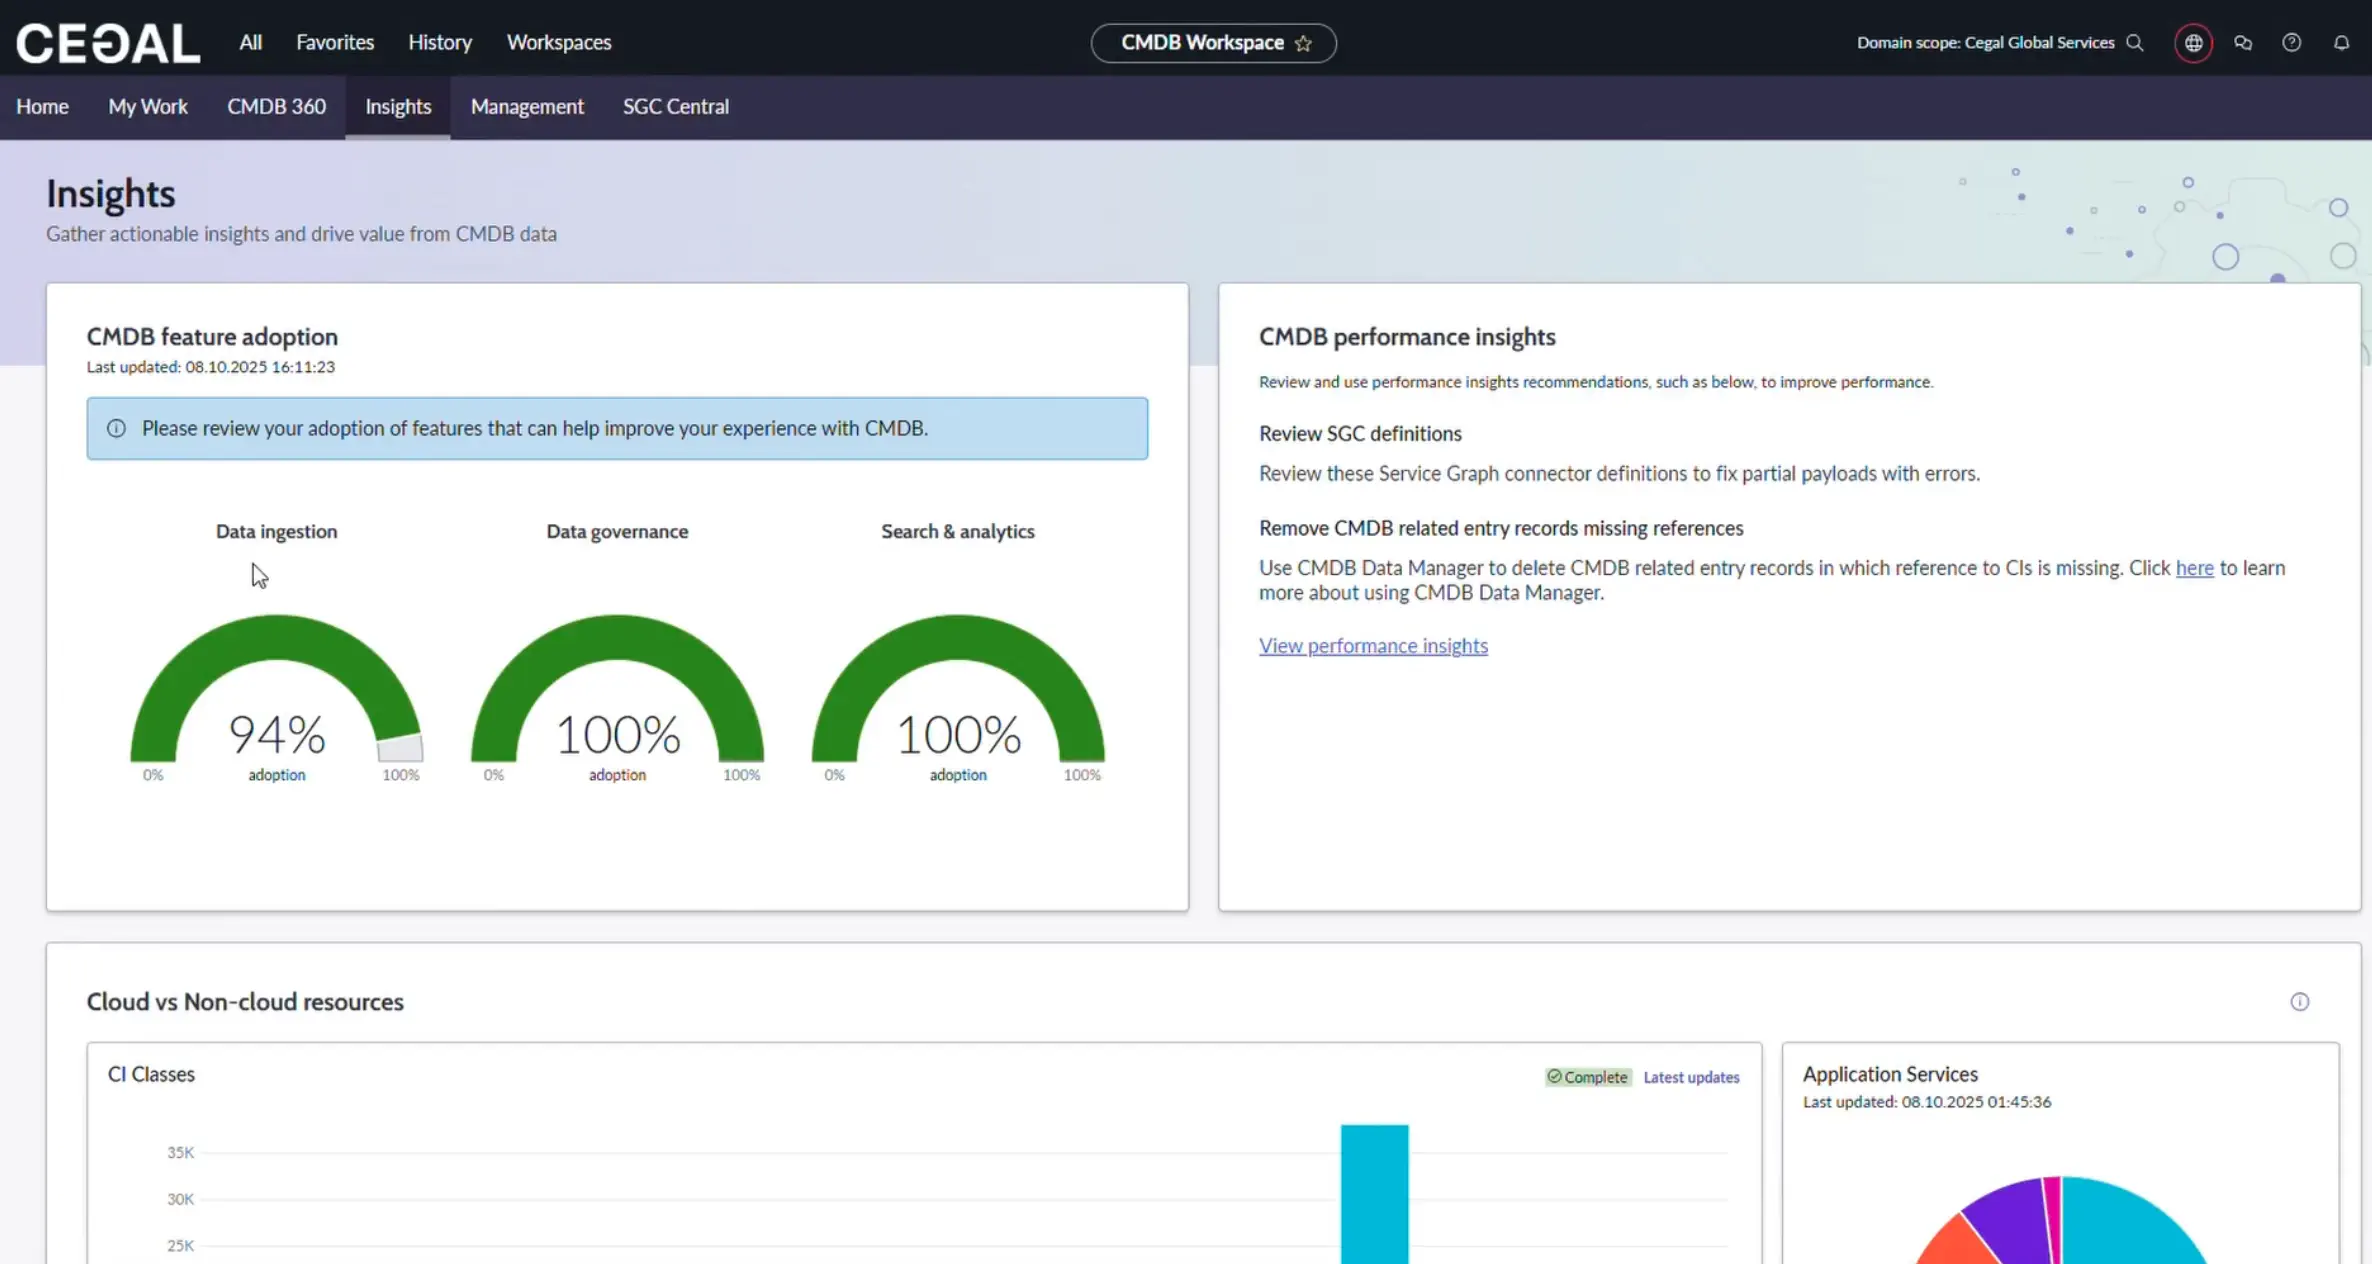
Insights tab
Track adoption and ingestion of CMDB capabilities:
- Data Ingestion: IRE processing volume and progress; overview of Service Graph connectors and transformation maps (IntegrationHub ETL)
- Data Governance: Governance progress/score
- Search & Analytics: Usage of analytics capabilities
- Trends: Application Services 7-day trend; Cloud vs Non-Cloud comparison
Reading the IRE metric
Higher “processed by IRE” counts generally indicate better identification & reconciliation coverage.
Best practices
- Prefer automation: Use discovery/connectors; avoid manual creation.
- Own the data: Ensure each CI has an owner and support group.
- Fix the source: If an attribute is consistently wrong, correct the upstream source.
- Watch trends: Track Health and 360 weekly to prevent drift.
- Save views/queries: Reuse filters and queries to standardize work.
- Document rules: Keep relationship allow-lists and attribute requirements current.
Troubleshooting
- I don’t see expected CIs → Check domain and roles; confirm discovery coverage in CMDB 360.
- Counts look off → Visibility limits across domains; verify with an admin.
- Duplicate CIs → Use Health (Correctness) and Relationship Health to reconcile.
- Slow queries → Narrow by class, time, or attributes; use saved queries for common slices.
FAQ
Can I export any list I see?
Yes — most lists support export to CSV/Excel/JSON/PDF from the export menu.
Where do I see a CI’s impact?
Open the CI → Dependency Views or Unified Map for relationships and related items.
Who should use Create CI?
CMDB administrators under defined governance only.