Logs & Monitoring
Monitor access activity, configuration changes, and security events.
Log tabs overview
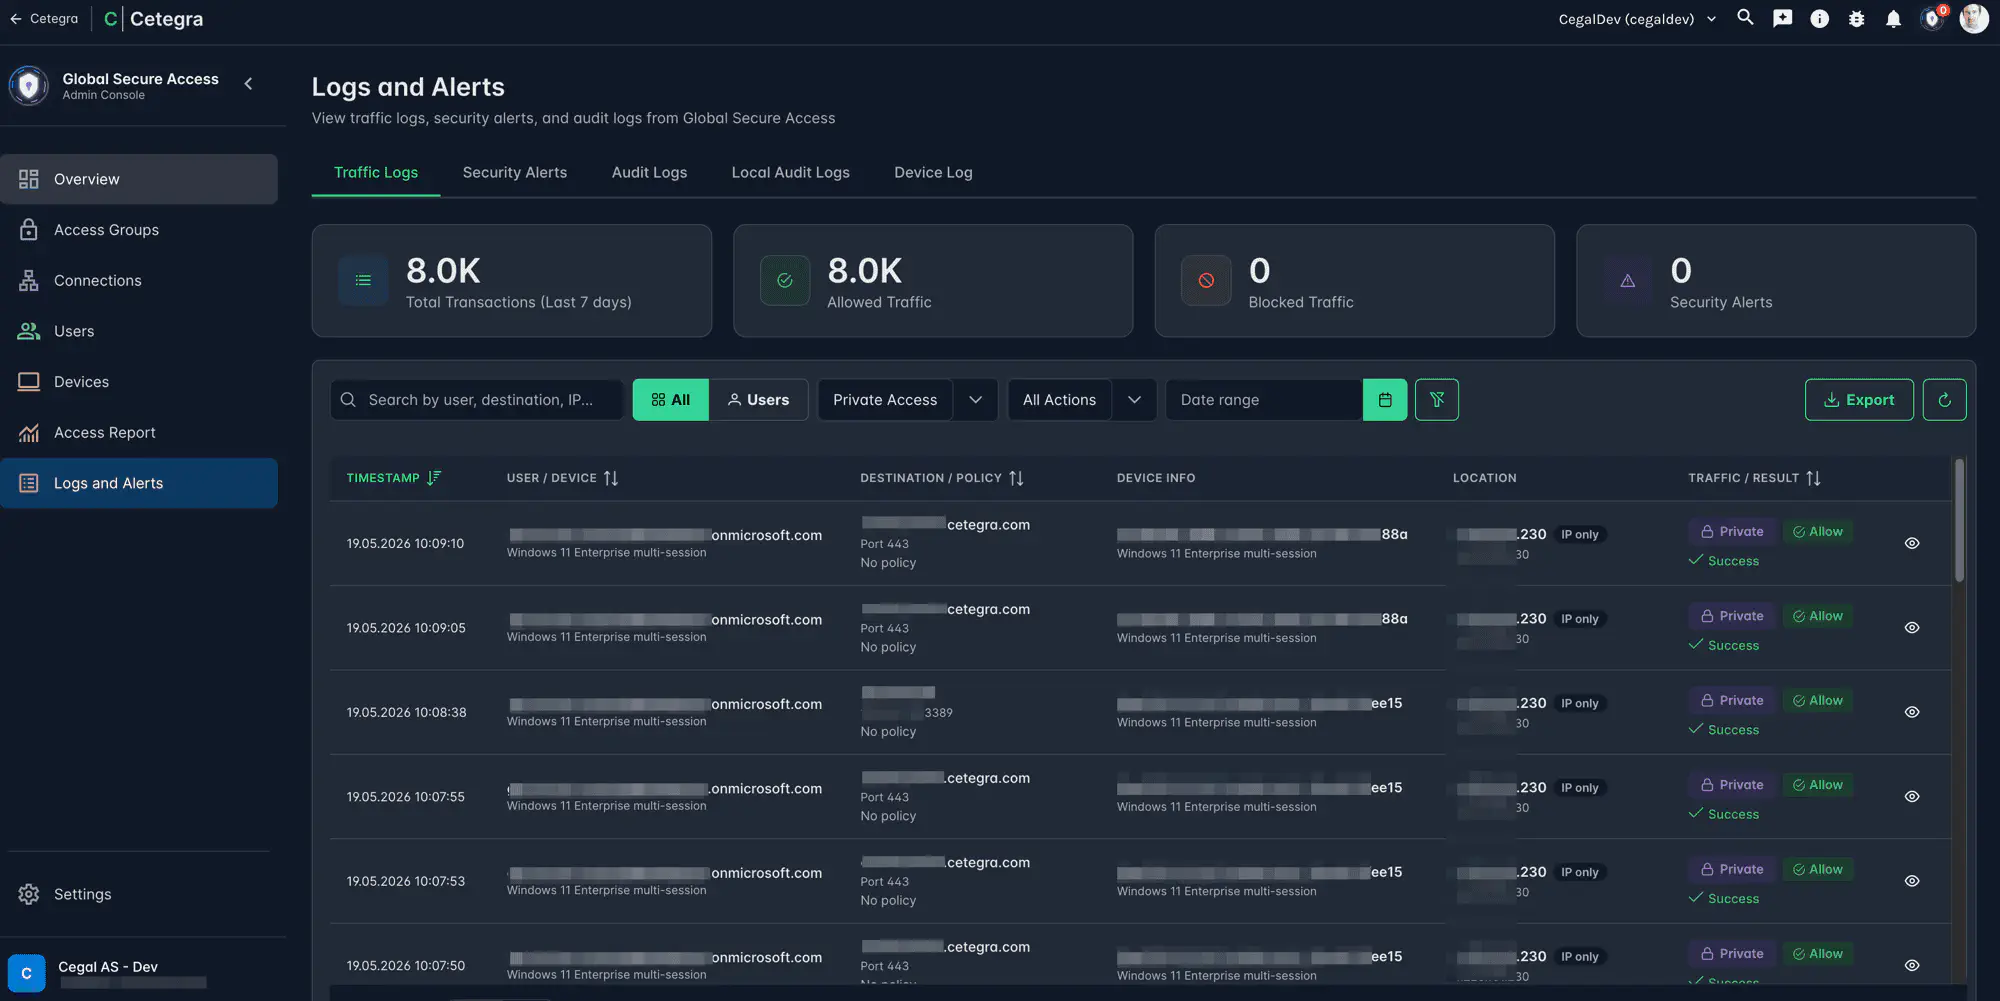
At the top of the page, a summary bar shows activity for the last 7 days:
| Metric | What it shows |
|---|---|
| Total Transactions | All connection attempts through the GSA client |
| Allowed Traffic | Connections that were permitted |
| Blocked Traffic | Connections that were denied |
| Security Alerts | Active security events |
The Logs and Alerts section has five tabs:
| Tab | What it shows |
|---|---|
| Traffic Log | Every connection attempt through the GSA client — who accessed what, when, and whether it was allowed |
| Security Alerts | Security events and policy violations from Entra Network Access monitoring |
| Audit Log | Configuration changes made to GSA settings in Microsoft Entra |
| Local Audit Log | Changes made through the Cetegra console specifically |
| Device Log | Device-level activity and connection events |
Traffic logs
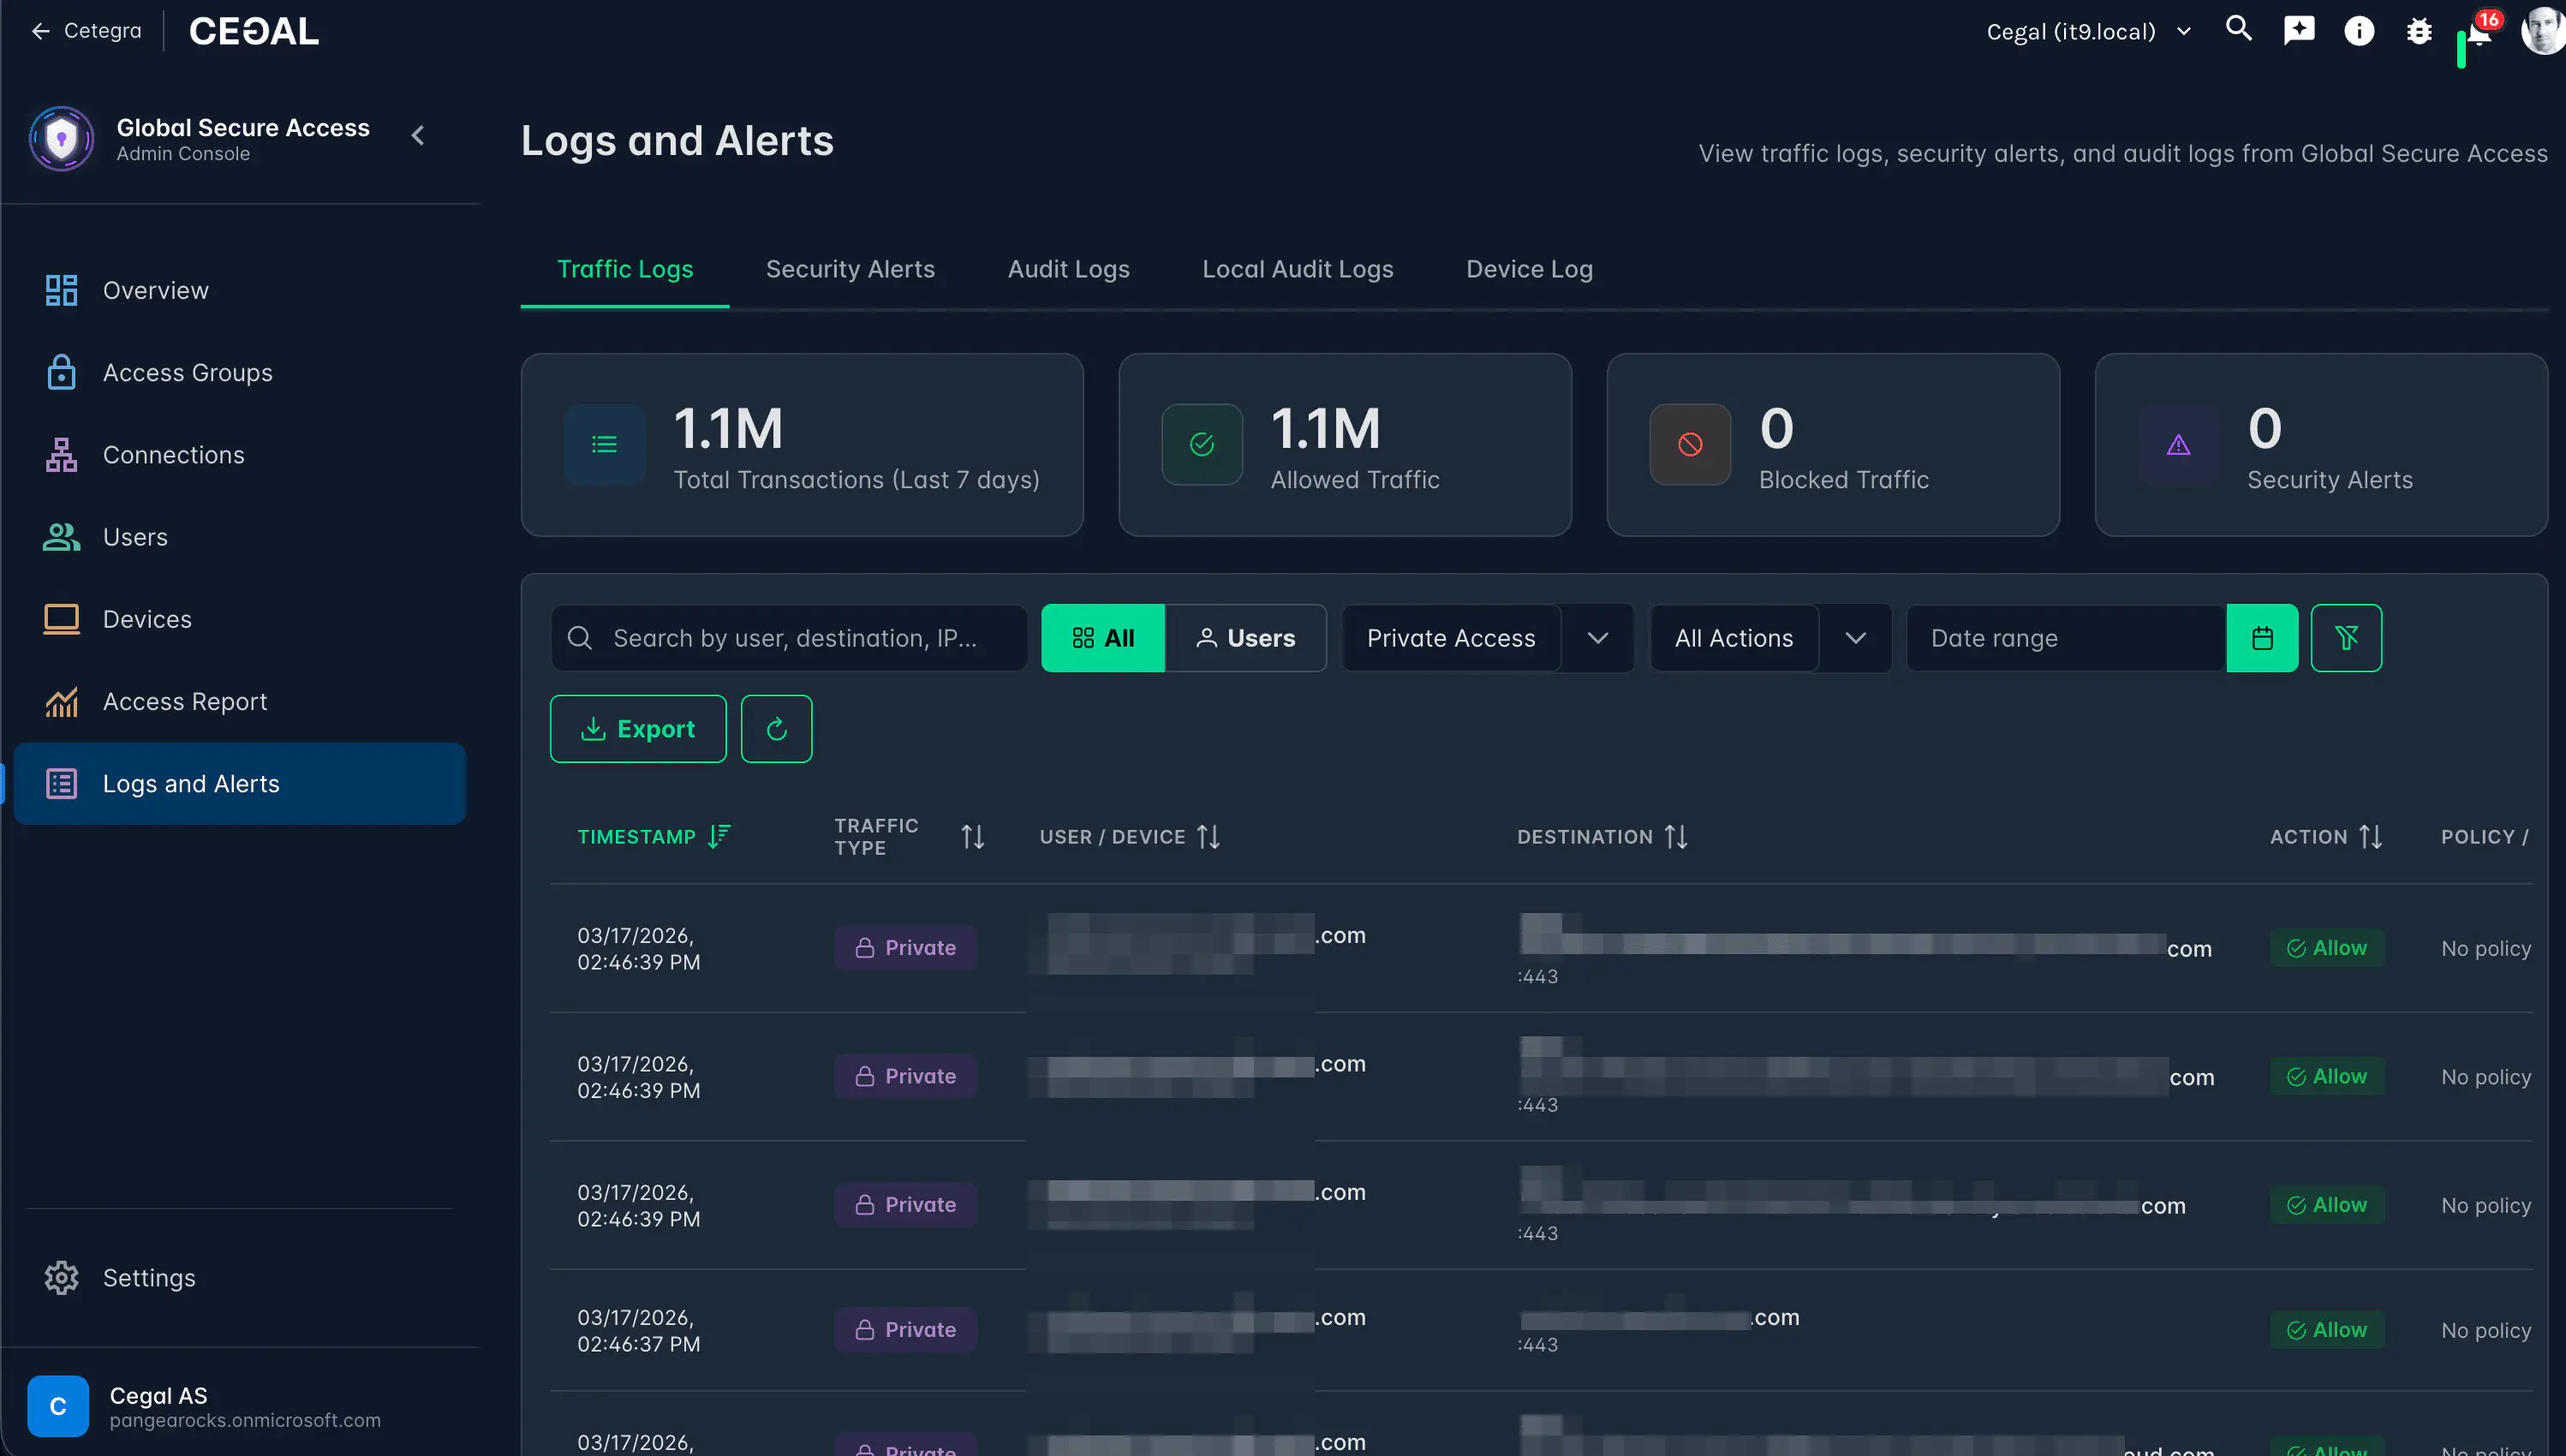
Traffic logs record every connection attempt through the GSA client. As a viewer, you can use these logs to:
- Confirm whether a user successfully reached a resource
- Find out why access was blocked
- Audit which resources have been accessed and by whom
Available filters:
| Filter | Use |
|---|---|
| Time range | Narrow to a specific period |
| Source IP | The user’s external IP address |
| Destination | Internal hostname, IP, or range |
| User | Filter by name or UPN |
| Application | Filter by enterprise application |
| Outcome | Allowed or Blocked |
Common lookups:
Is a user reaching a specific resource?
Filter by username and destination. Look for Allowed entries with the correct destination and port.
Why is access being blocked?
Filter by username and Blocked outcome. The log entry includes the reason — policy, no matching segment, no active connector, etc.
Who accessed a specific server over the past week? Filter by destination and set the time range to the relevant period.
Audit logs
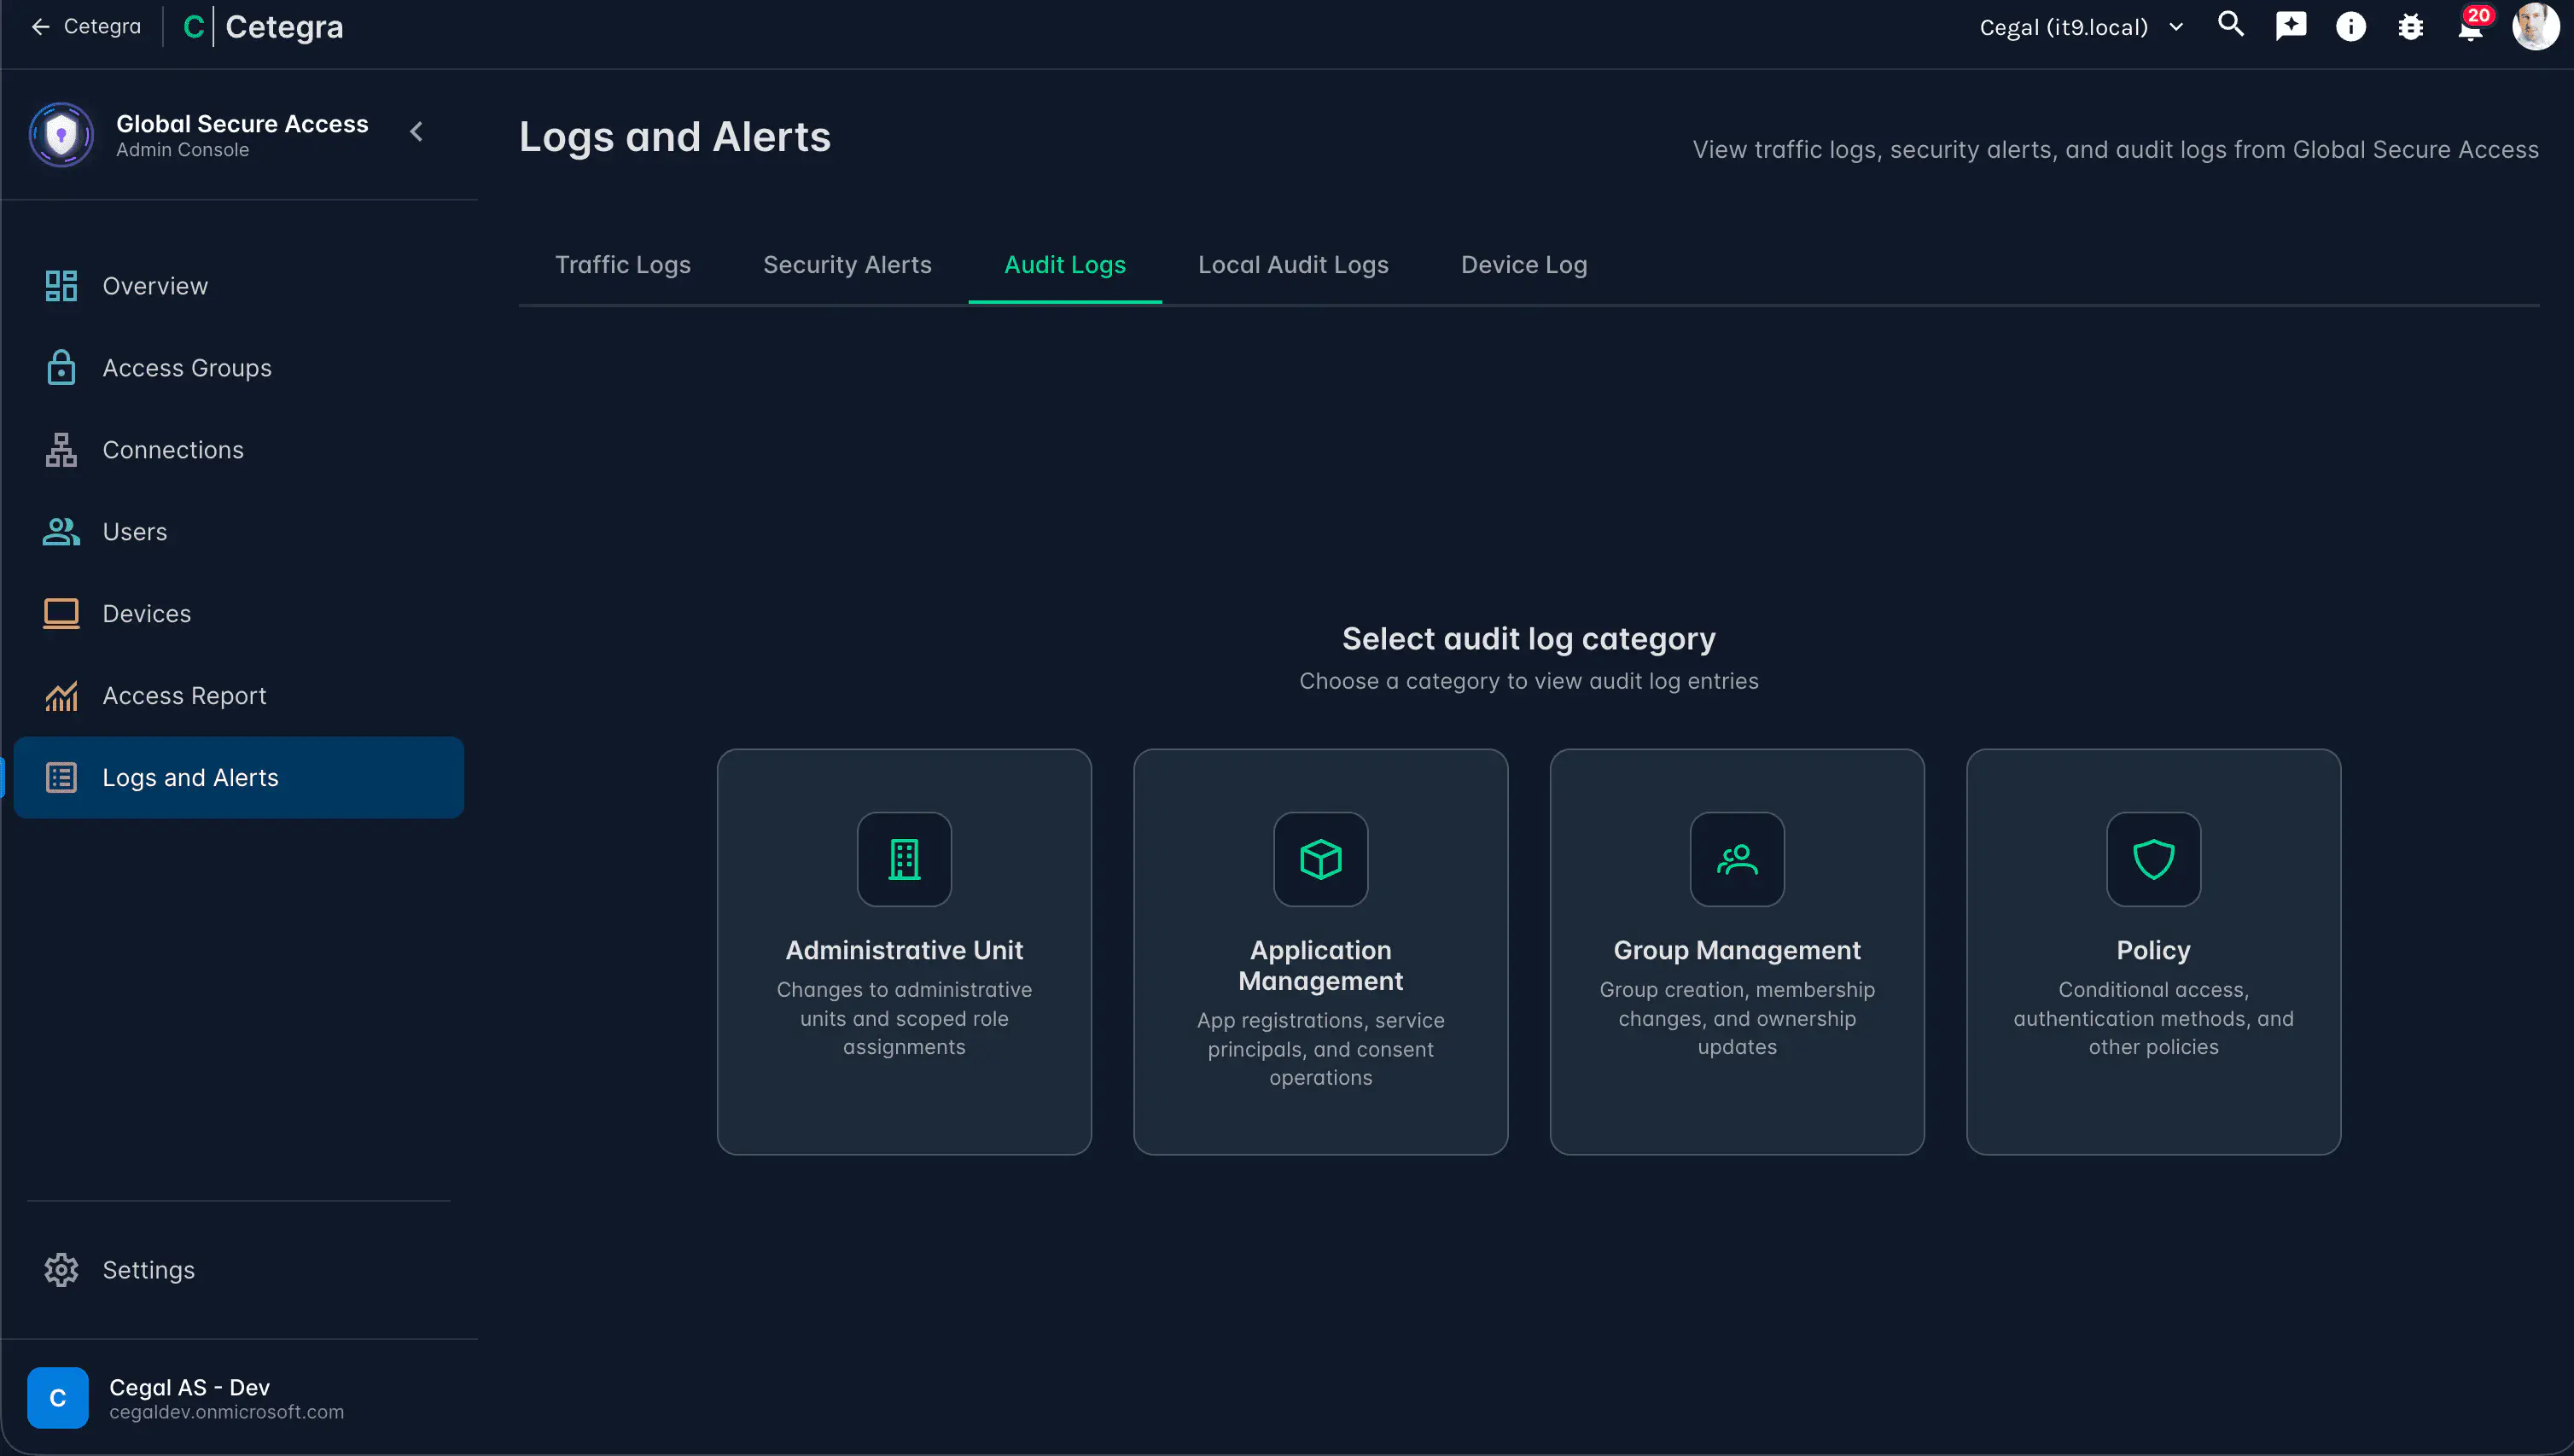
The Audit tab shows configuration changes in Microsoft Entra. Select a category to filter the entries shown.
Categories
| Category | What it covers |
|---|---|
| Administrative Unit | Changes to administrative units and scoped role assignments |
| Application Management | App registrations, service principals, and consent operations |
| Group Management | Group creation, membership changes, and ownership updates |
| Policy | Conditional access, authentication methods, and other policies |
Entry structure
| Column | Description |
|---|---|
| Date/Time | When the event occurred |
| Activity | The operation performed |
| Target | The resource that was changed |
| Initiated by | The user or service that triggered the change |
| Result | Success, Failure, or Timeout |
Filters
- General search — free-text search across activity, target, and initiated by
- Result — filter by
Success,Failure, orTimeout - Date range — narrow to a specific period
Useful for answering questions like:
- “When was this connection last modified?” → Application Management
- “When was this access group created or modified?” → Group Management
- “Has the conditional access policy changed recently?” → Policy
Local audit logs
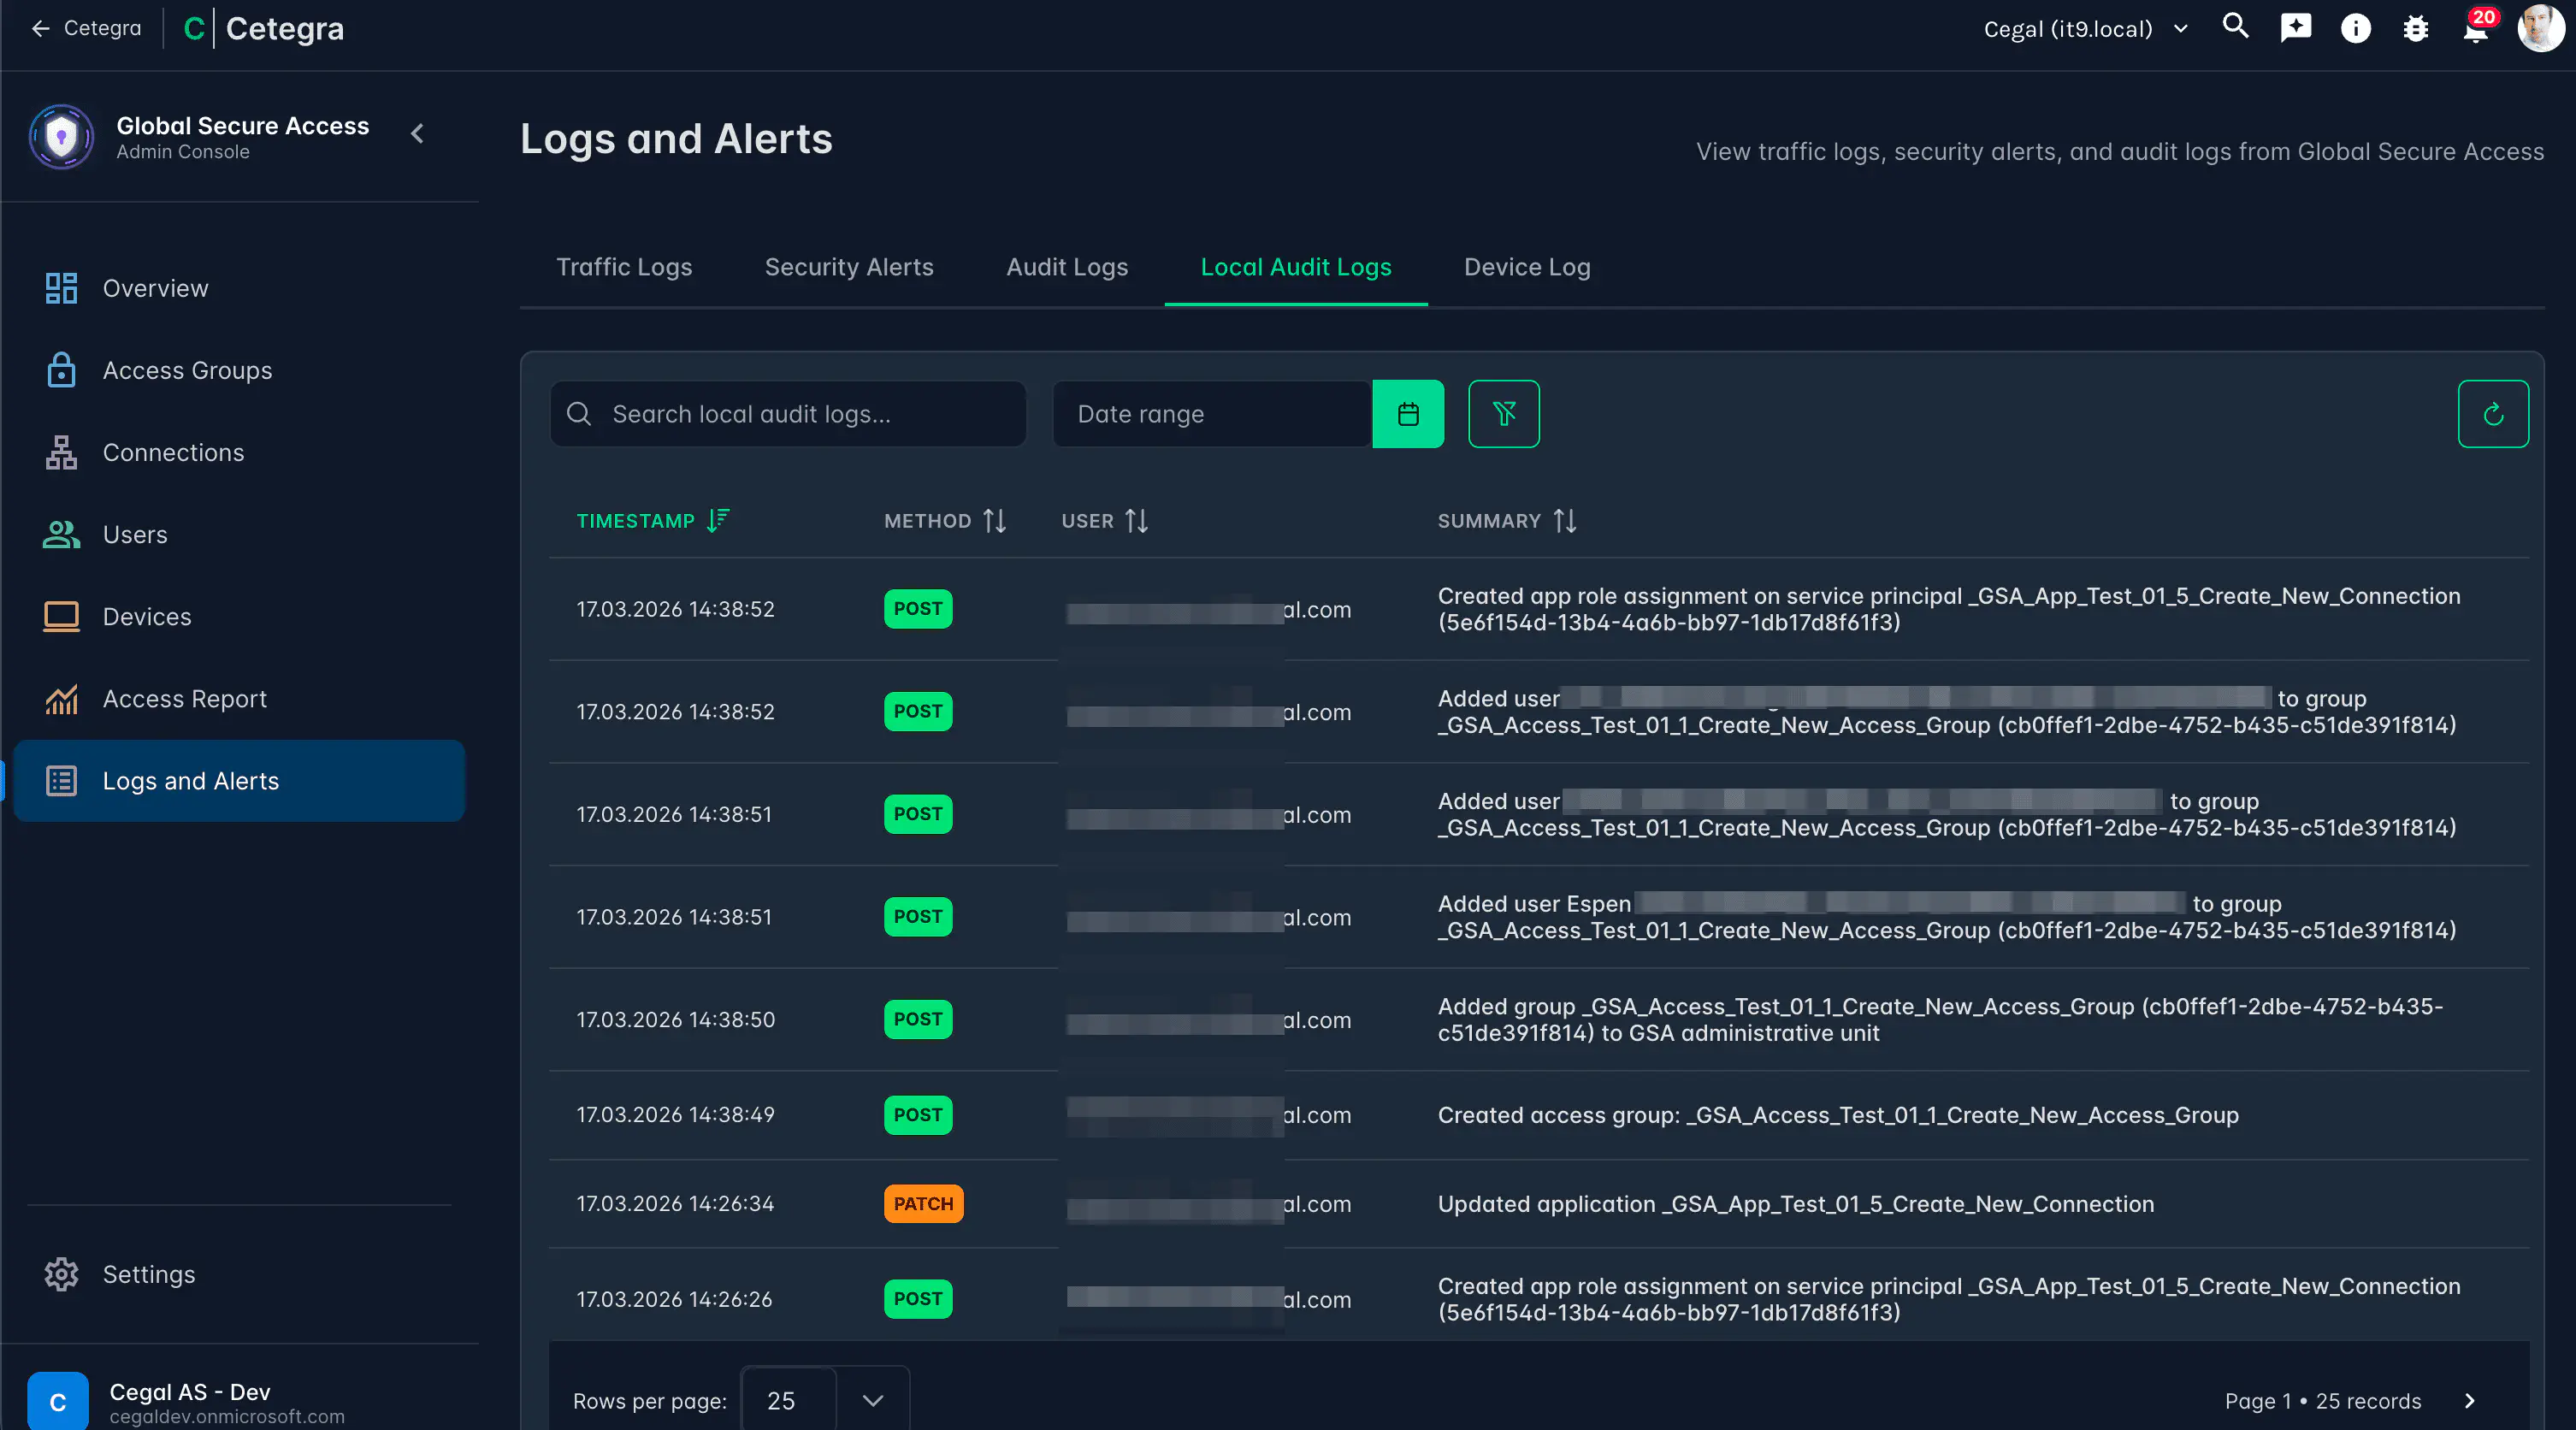
The Local Audit tab shows changes made specifically through the Cetegra console (not changes made directly in Entra). This is useful when you need to attribute a configuration change to a specific console user.
Each entry includes:
- Timestamp
- User who made the change (UPN)
- What resource was affected
- Operation type (create, update, delete)
- A Correlation ID for cross-referencing with the Entra audit log
Security alerts
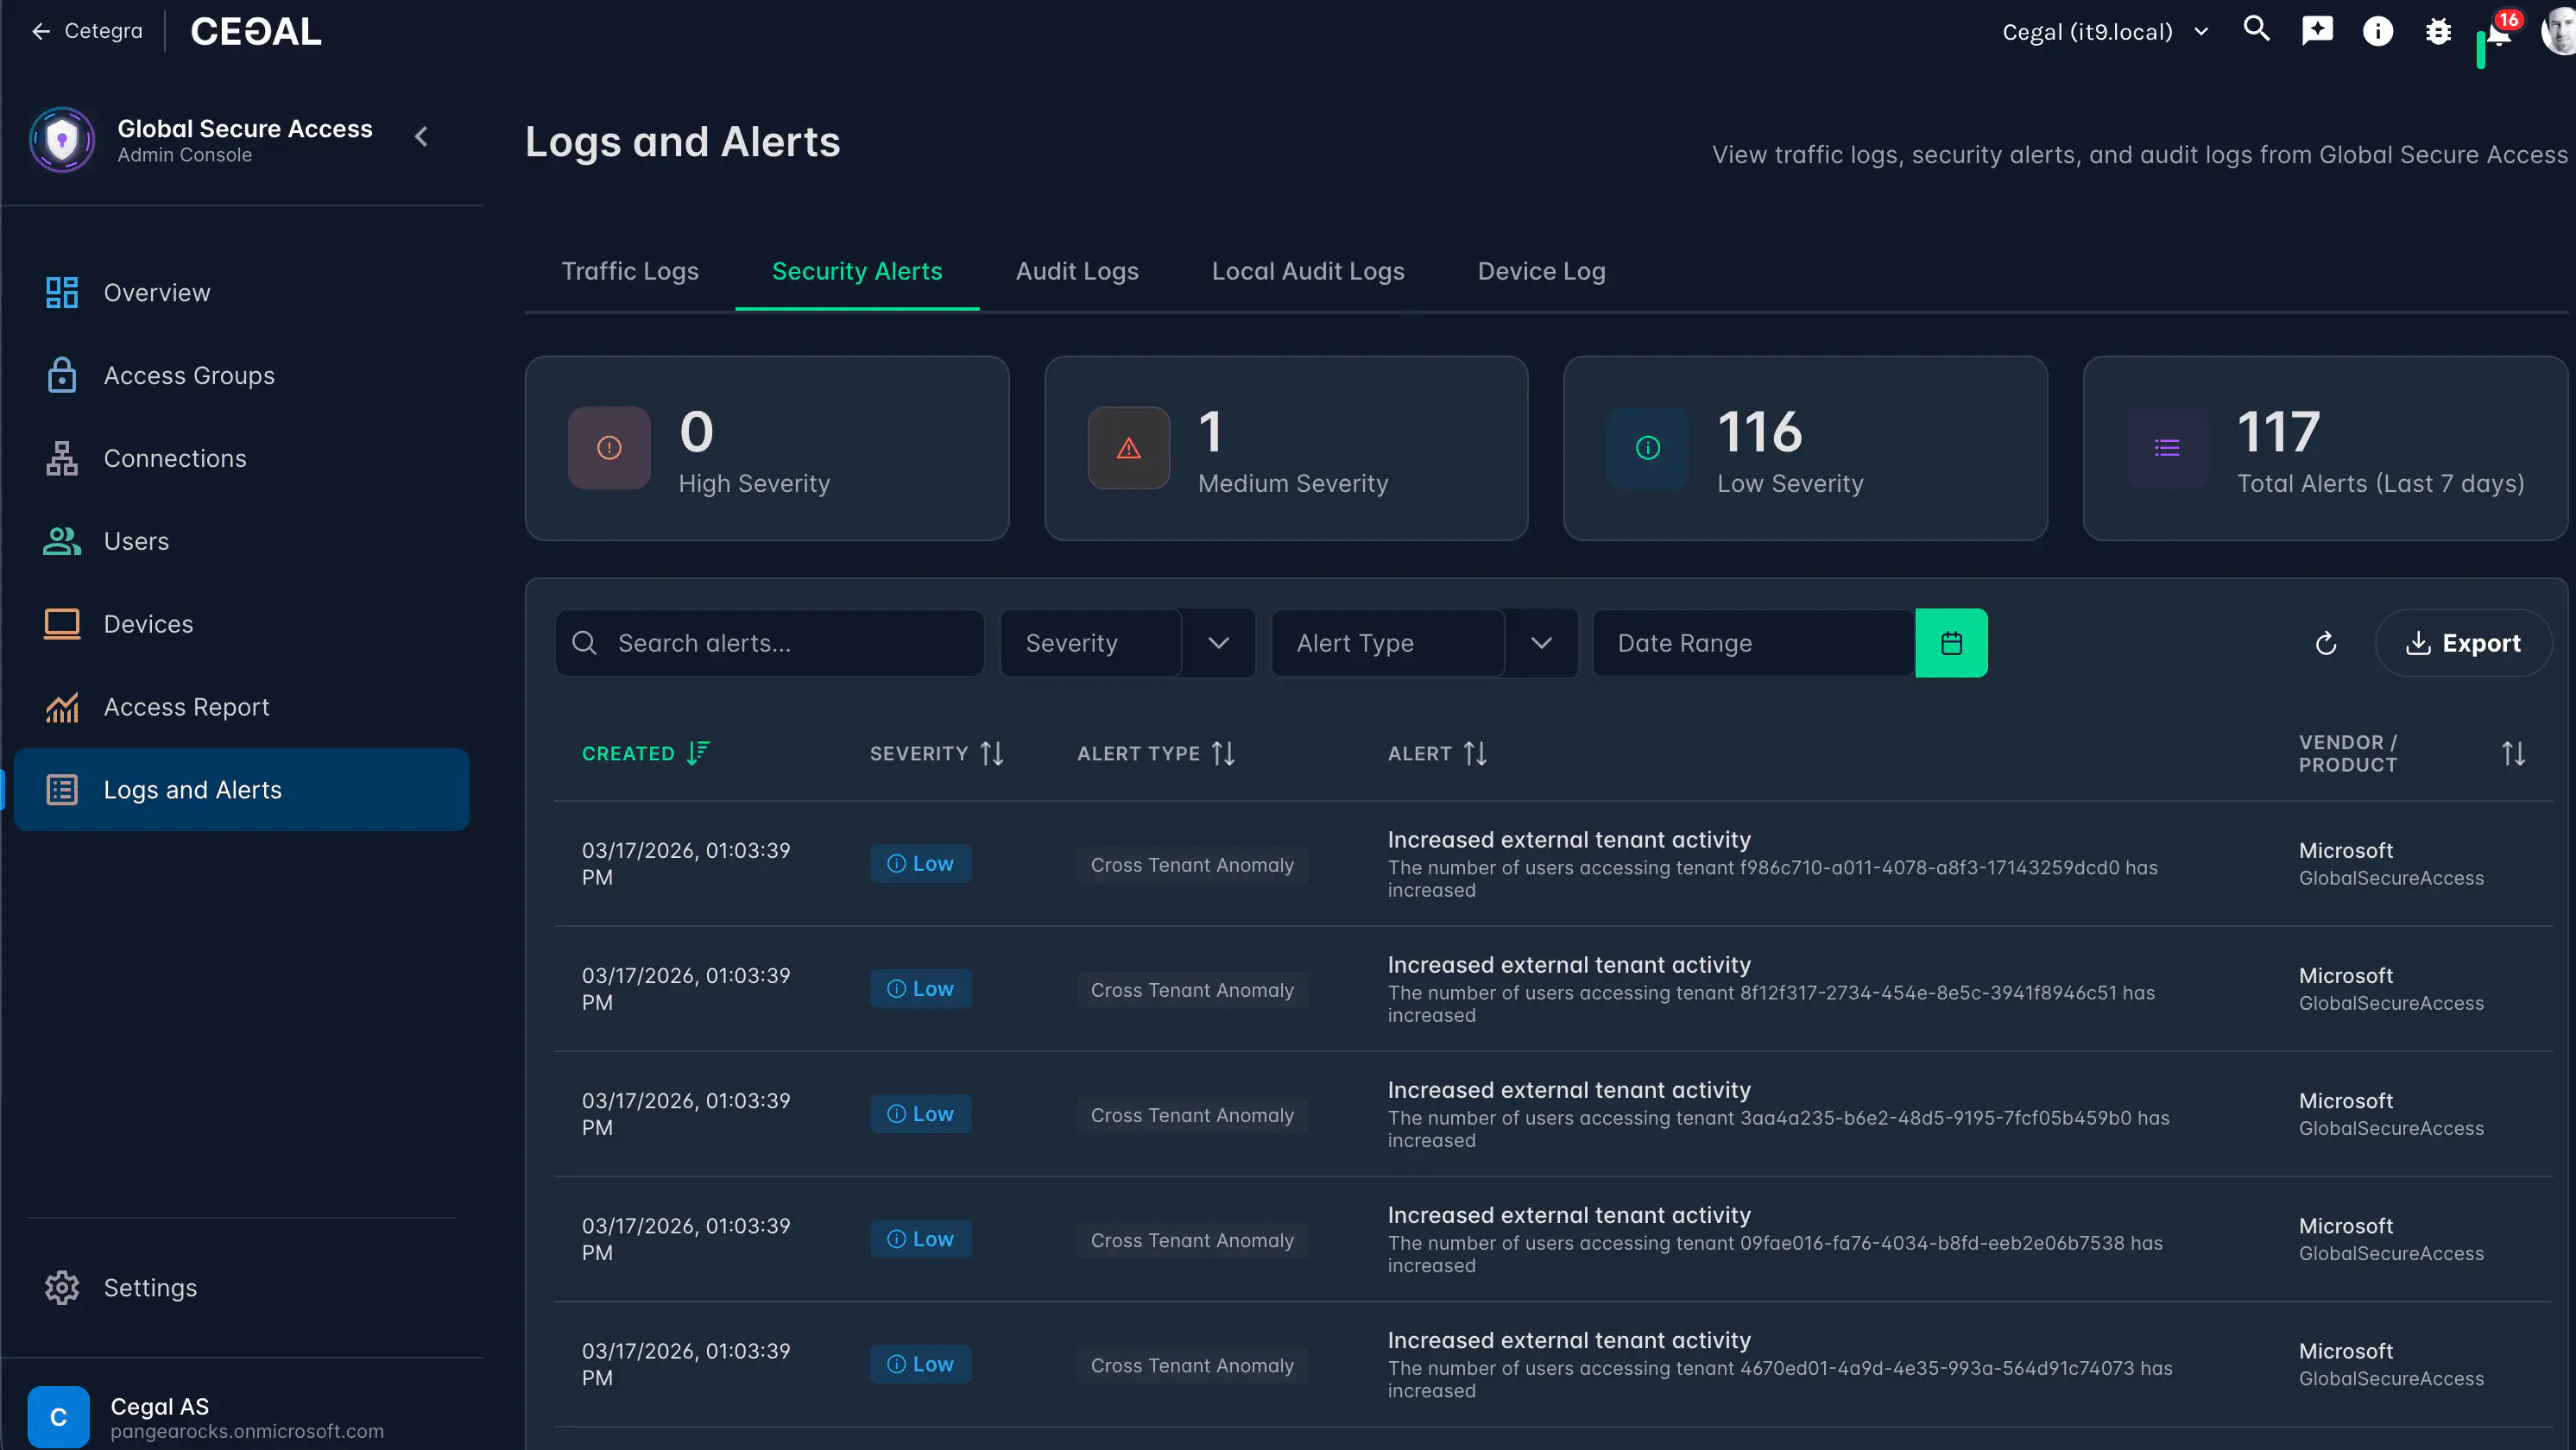
The Security Alerts tab surfaces events from Microsoft Entra Network Access monitoring. Alerts are grouped by severity:
| Severity | Typical meaning |
|---|---|
| Critical | Access disruption or critical security gap — escalate immediately |
| High | Significant issue requiring prompt attention |
| Medium | Should be reviewed, but not immediately blocking |
| Low | Informational — review periodically |
Alert types include dependency issues (missing connectors or policies), secret expiry warnings, version issues, and licensing gaps.
If you see Critical or High alerts, report them to your Cetegra administrator promptly.
Jobs
Background import and sync operations are tracked in the Jobs section.
| Status | Meaning |
|---|---|
| Queued | Waiting to start |
| Running | In progress |
| Completed | Finished successfully |
| Failed | Encountered an error |
Jobs are initiated by Cetegra administrators. If a job shows as Failed, report it to your Cetegra administrator along with the job timestamp and any error message shown.