Insight Report
This guide will help you understand how to navigate and use the various features and filters available in the report. The report comprises two main sections: the Dashboard and the History Page.
Introduction
The Cetegra HPC Insight Report provides a comprehensive overview of your Cetegra HPC (High Performance Computing) environment. It offers insights into the cost distribution, user activity, and job details, allowing you to monitor and optimize your HPC usage.

Filters Overview
To help you customize the data display, several filters are available:
- Date range: Filter jobs based on their start date.
- Queue: Filter data for specific queues.
- User Name: Filter information for specific users.
Dashboard
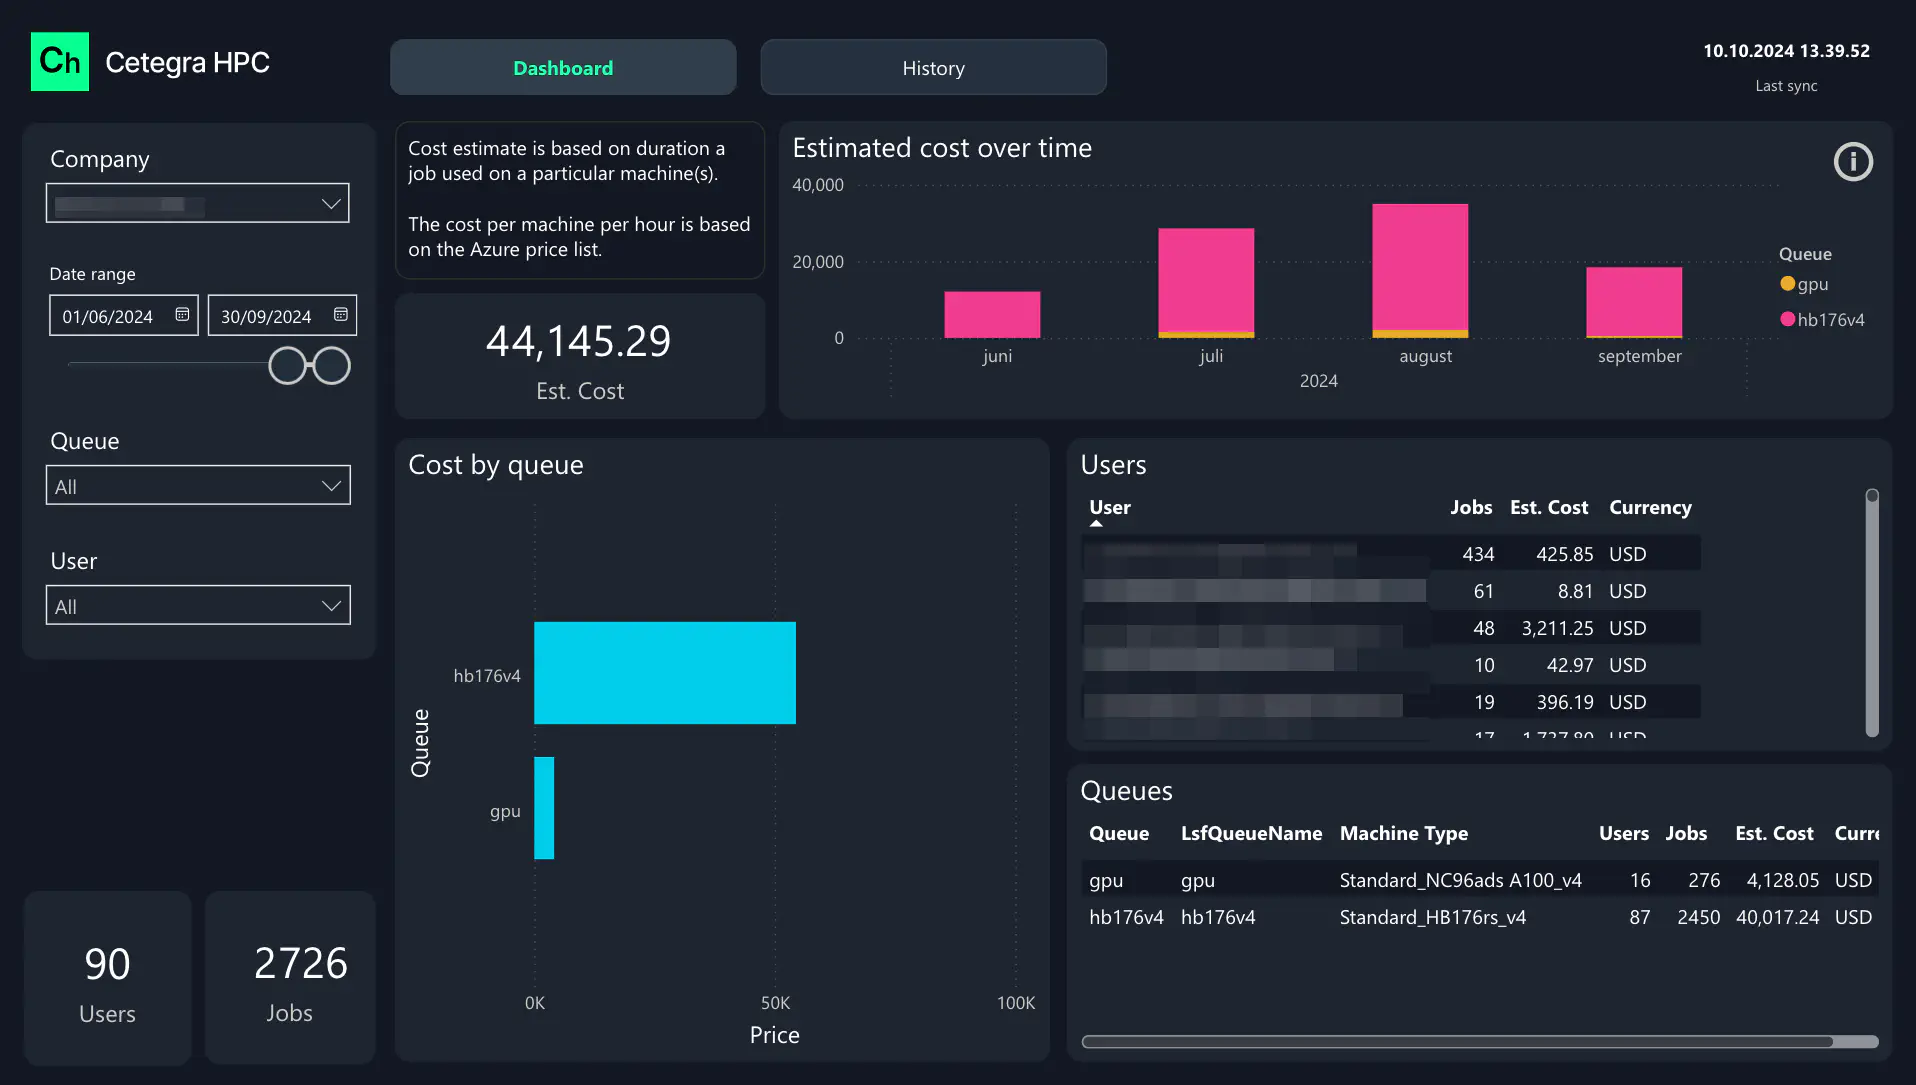
The Dashboard provides an at-a-glance view of the key metrics in your HPC environment. Below are details on each section:
Estimated Cost
- Displays the total estimated cost of all jobs within the selected filter criteria.
Cost Over Time
- Bar chart showing the cost distribution over time.
- The chart allows for drill-down functionality by Year, Month, and Day.
- Legend denotes the Queue.
Cost by Queue
- Clustered bar chart representing the cost associated with each queue.
User and Job Summary
- A table displaying:
- Users
- Number of Jobs
- Estimated Cost
- Currency
Queue Details
- A table showing:
- Queue Name
- Machine Type (Azure SKU)
- Number of Users
- Number of Jobs
- Estimated Cost
- Currency
History Page
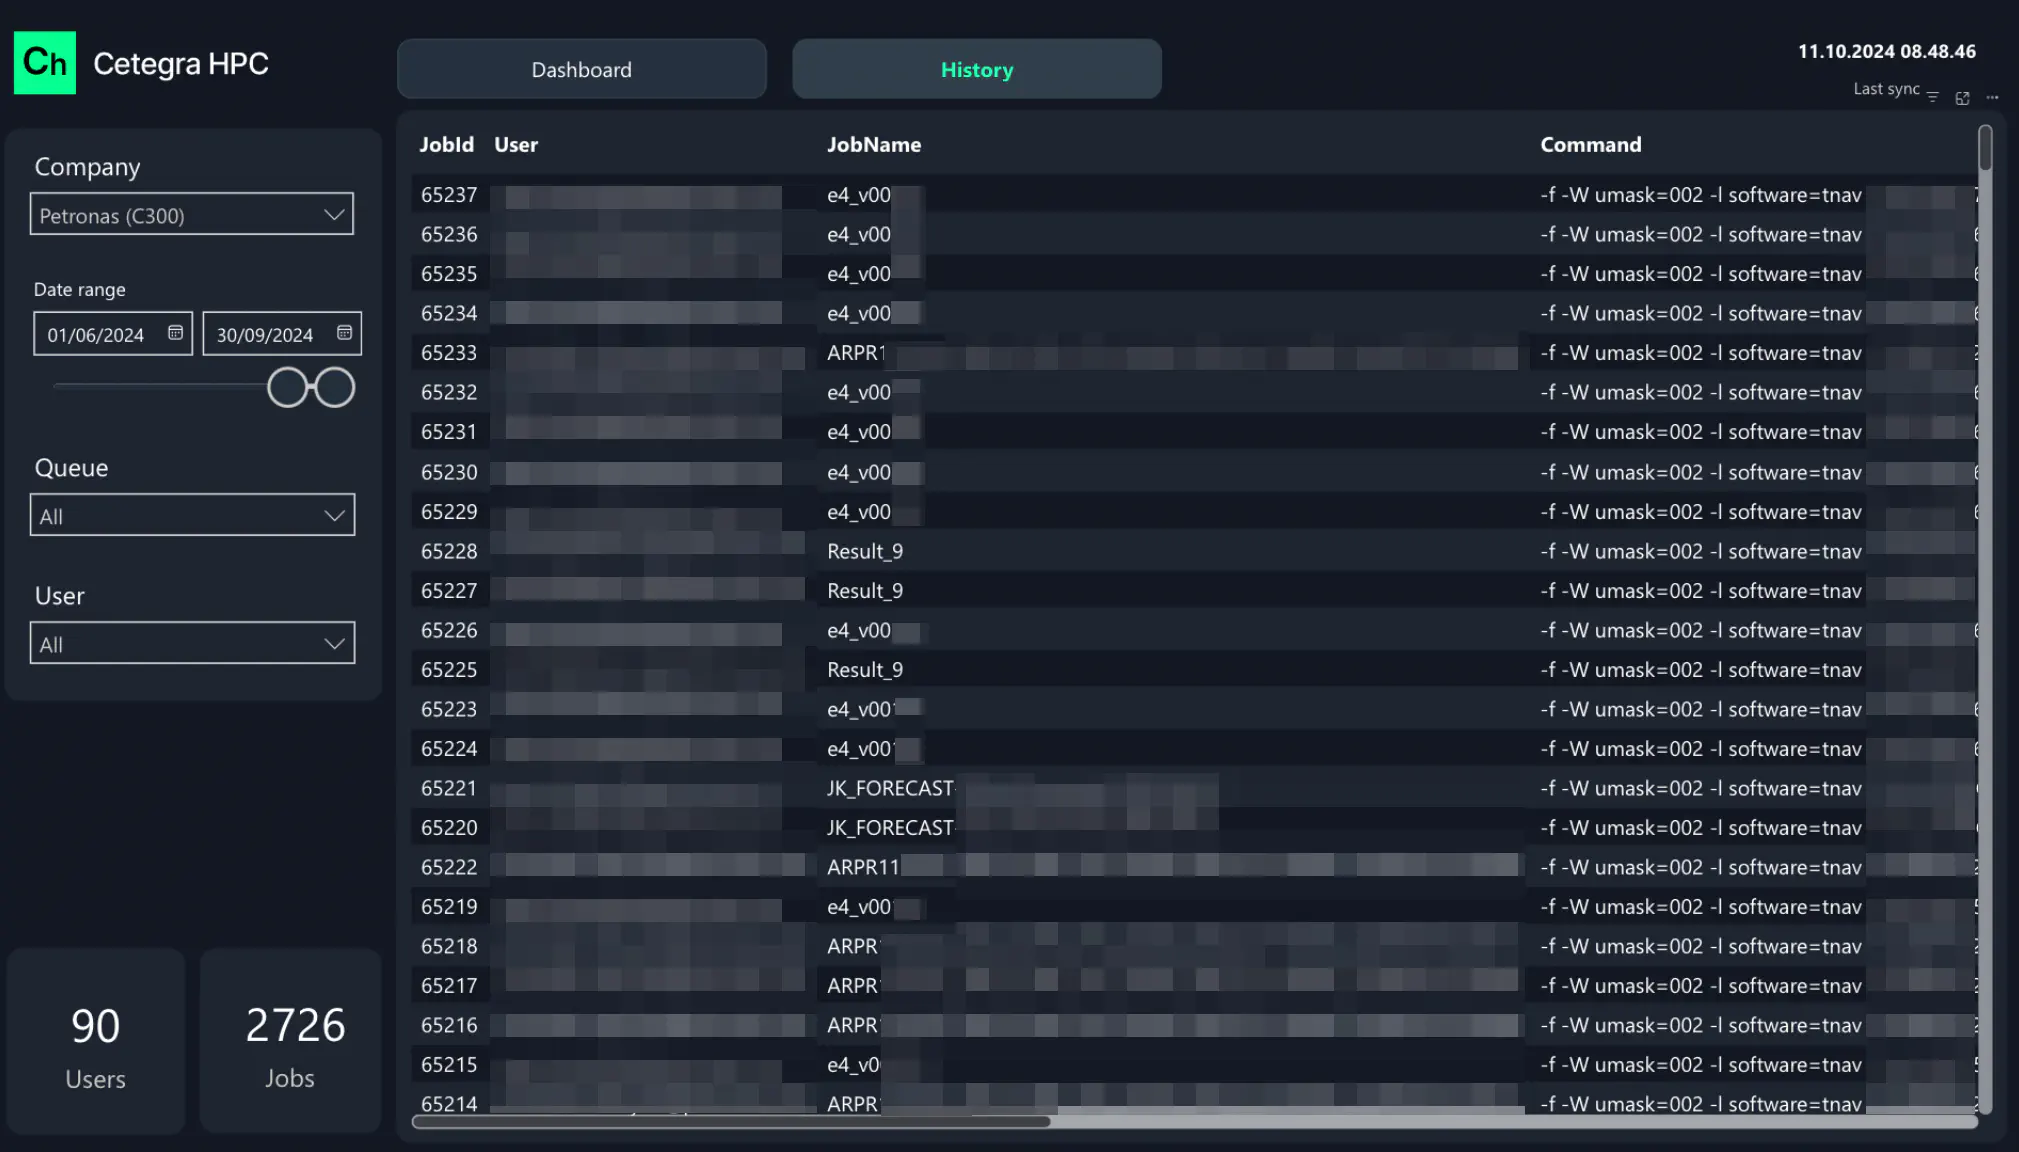
This page offers a detailed history of all jobs with the same filtering options as the Dashboard.

Job Details
- A comprehensive table listing each job’s attributes, including:
- Job Name
- Startup Command
- User Name
- Job ID
- Queue
- Status
- Software (if available)
- Start Date
- Stop Date
- Price
- Queue and Machine Details
- Number of Cores and Nodes used
- Estimated Price Calculation Basis
General Information
- Estimated Price Calculation: The price is estimated based on the job’s duration, number of nodes, and cores utilized. The formula involves calculating the price per second by multiplying the duration with the cost per second of the SKU used and then accounting for the number of nodes (or node fractions) utilized.
- The last update date of the report is displayed at the top right corner for your reference.
By following this guide, you should be able to efficiently navigate and understand the various aspects of the Cetegra HPC Insight Report. If you have further questions, please contact us.